Heat Consumption
Problem Description
In this use case, heat is delivered by water. Water heating is a heat transfer process that uses an energy source to heat water above its initial temperature. Typical domestic uses of hot water include cooking, bathing, and space heating. The water is heated in a boiler using fuel (gas, oil or coal) and driven through the pipe by water pumps. Thus, energy is consumed.
As ensuring energy efficiency is of significant importance, it is vital to ask: “Is the consumed energy/heat consumption appropriate under the given circumstances?”. And if not, "What are the possible explanations behind this inadequacy?" This use case highlights the importance of continuous monitoring of heating system health and root cause analysis.
The goal is to automate data interpretation to deliver actionable maintenance recommendations. Concretely, there are 89 buildings, each of them having the consumption of energy/heat of that given building as KPI. The influencers are metered data like the temperatures of incoming and outgoing water flow, the amount of water flowing through the pipe and meteorological data like the outside temperature, wind speed and wind direction. In case of suspicious behavior of the heat consumption of any building, there should be an alert; knowing when something abnormal is happening allows doing inspections in the correct city, of the proper building, and at the right time. In addition, it is vital to have the possibility to analyze potential root causes of a given anomaly. This directs to possible reasons behind an abnormal situation (a data problem, a ruptured pipe, a loss of system pressure, stealing of water, issues with a radiator or boiler, etc.). The determined root cause may be a decisive factor in whether to do an inspection or not and, if so, which components of the system are under suspicion of not working correctly/adequately.
Demonstration
This section serves as a demonstration of root cause analysis in TIM Studio. Download the data by clicking on the download link.
KPI
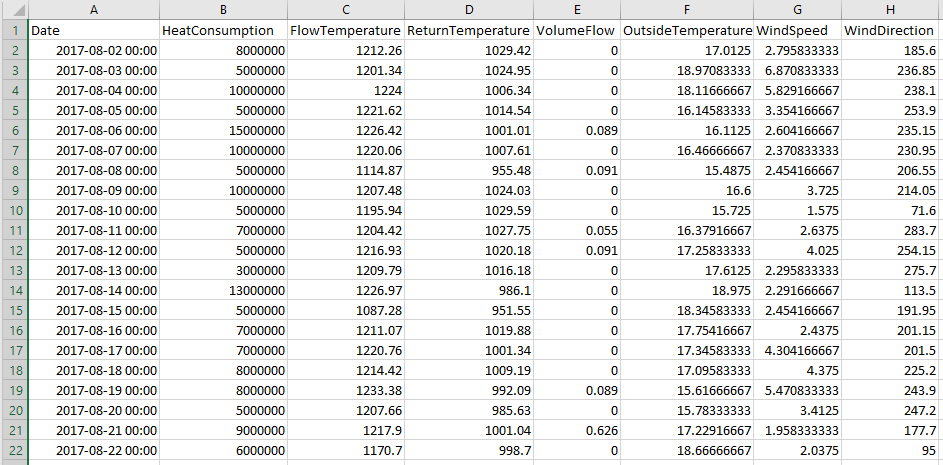
The data used in this example are assembled from a building in the Netherlands. The heat consumption of this building is the KPI. This KPI is the second column in the CSV file, right after the column with timestamps. In this case, the name of the KPI is HeatConsumption. The data has a daily sampling rate.
Influencer candidates
As influencers, flow temperature, return temperature, volume flow, outside temperature, wind speed and wind direction are used. Thus, for model building, historical actuals of meteorological data as well as metered data are used. As the same historical data would be available in the daily operational mode, this is a representative simulation. The data used in this example covers the period from 2017-08-02 00:00:00 to 2018-10-25 00:00:00.
TIM Studio demonstration
The next part show a step-by-step on how to perform RCA in TIM Studio. The demonstration than goes further to take a look at potential root causes of concrete anomalies.
As this demonstration is meant to cover RCA on anomaly detection models, it starts out in an anomaly detection experiment with an executed or selected build-model job (i.e. the user is looking at the results of an anomaly detection model building job). More information on how to navigate TIM Studio and create such an experiment can be found starting in the section on navigating TIM Studio. The model that is started from in this solution template is built with default configuration.
The results of an anomaly detection (build-model) job
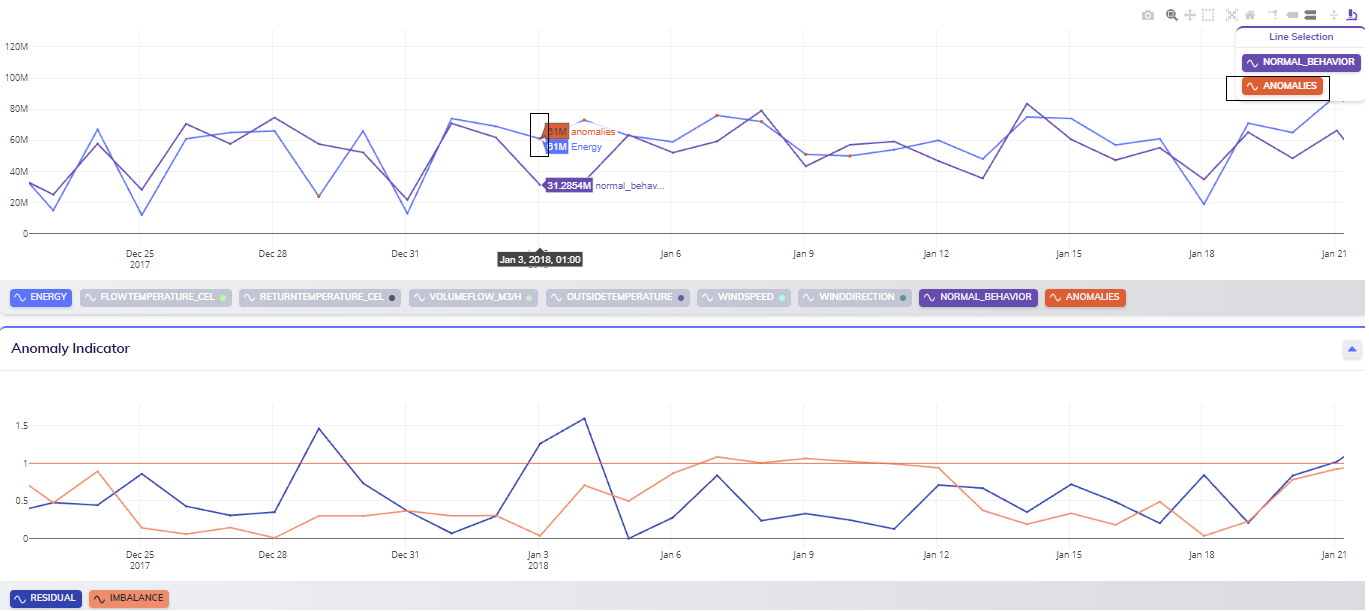
The results of the job that should be visible at the start of this walkthrough should look something like in the image below:
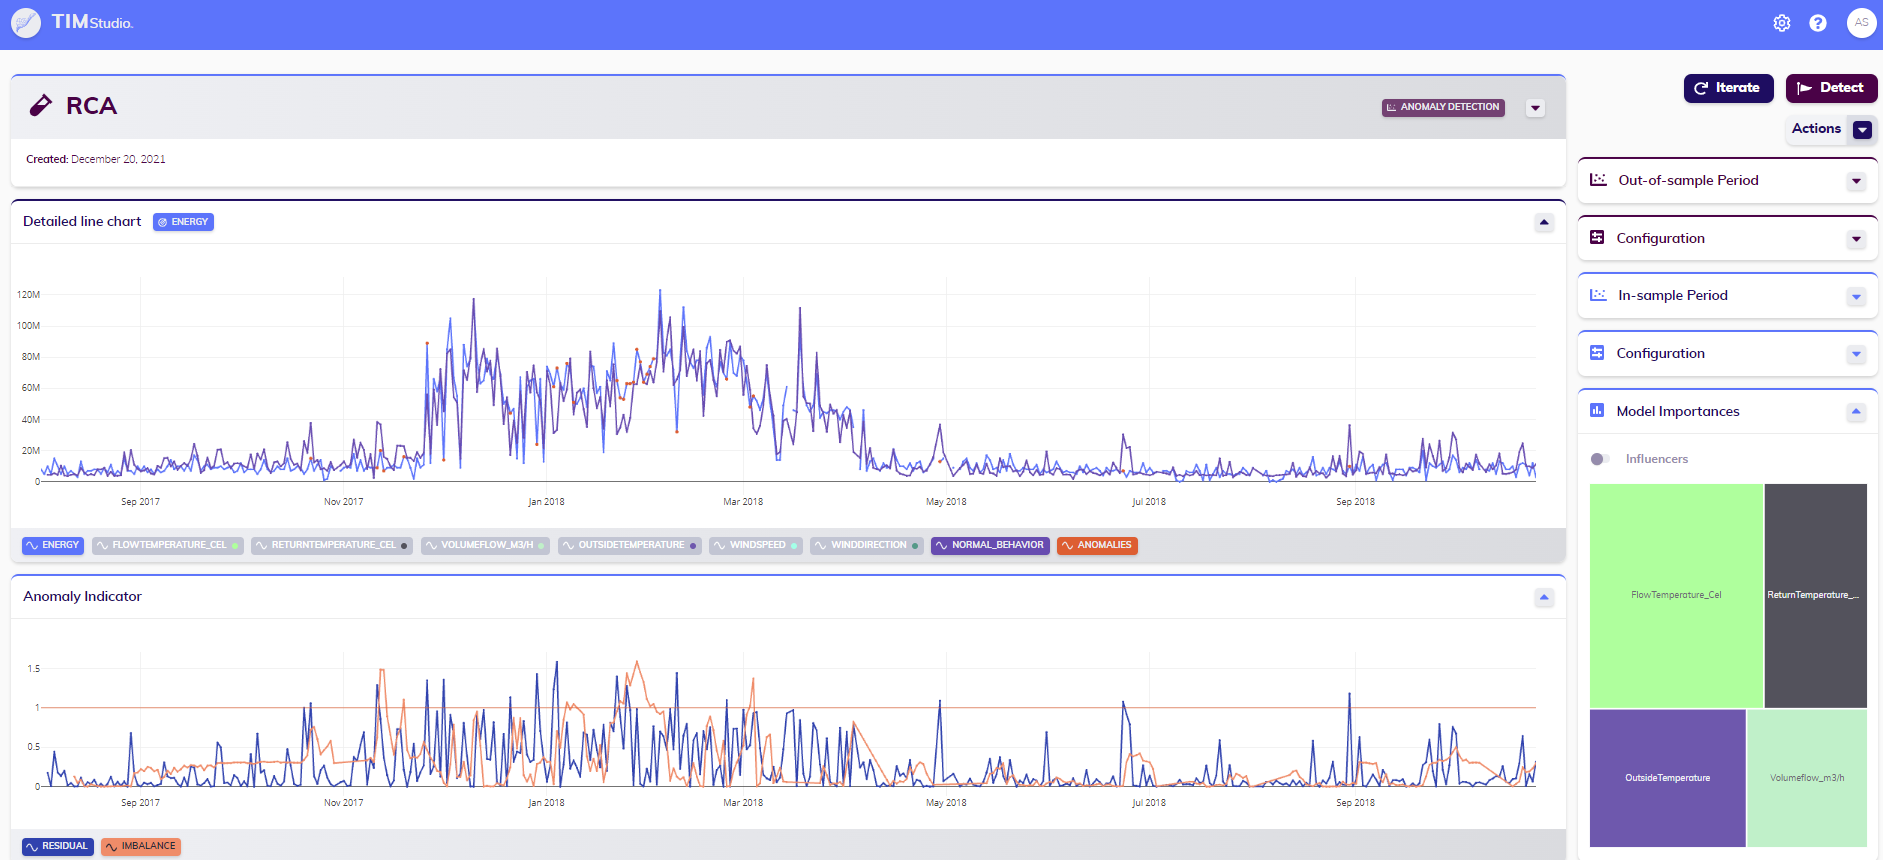
The main outputs that are important to notice now are the normal behavior, the anomaly indicators, the detected anomalies and the model importances. Variables can be selected and deselected in the line chart to the user's preferences, and the line chart also support zooming and other manipulations. The main line chart and the anomaly indicators line chart are synchronized: this means their zooming and panning remain in the same state, and only anomalies detected based on a selected anomaly indicator are visualized in the top line chart.
Root cause analysis
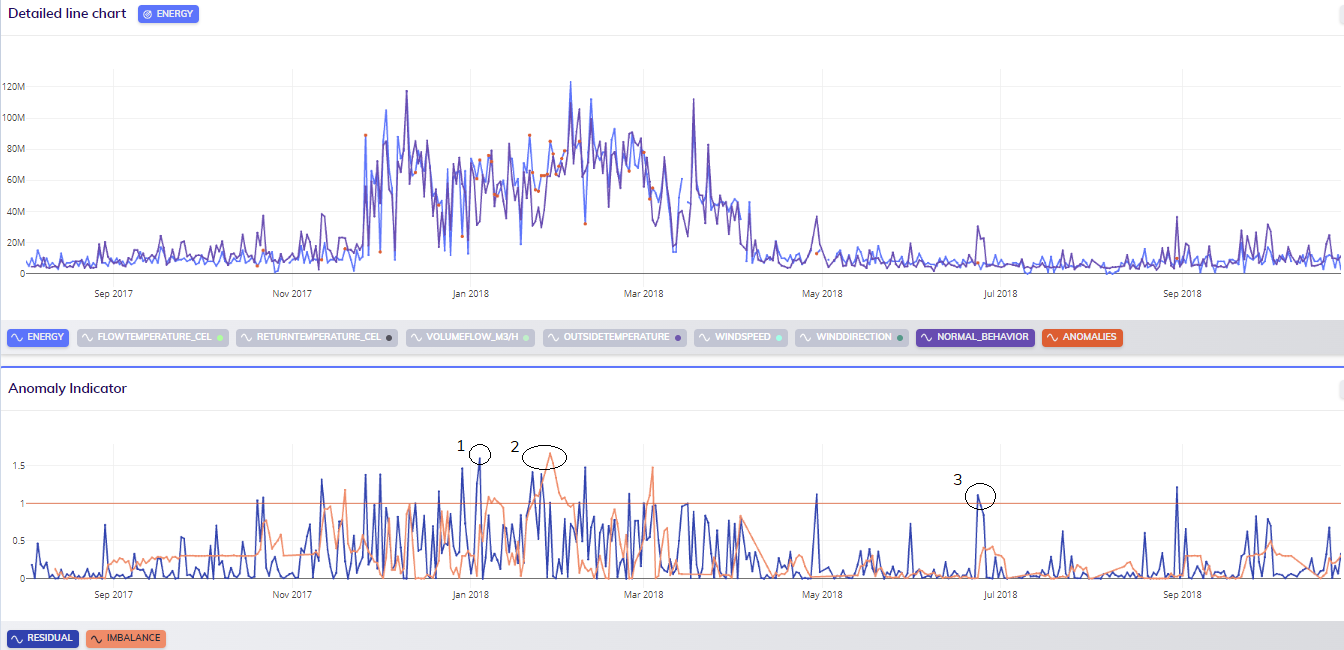
The next step is to analyze the possible root causes of the most suspicious situations in the output above. The situations to inspect are indicated in the image below (1, 2 and 3). In all of these situations, the anomaly indicator representing the residuals perspective crossed the threshold. In situation 2, the anomaly indicator representing the imbalance perspective also crossed the threshold. This can suggest there is a problem of a longer duration.
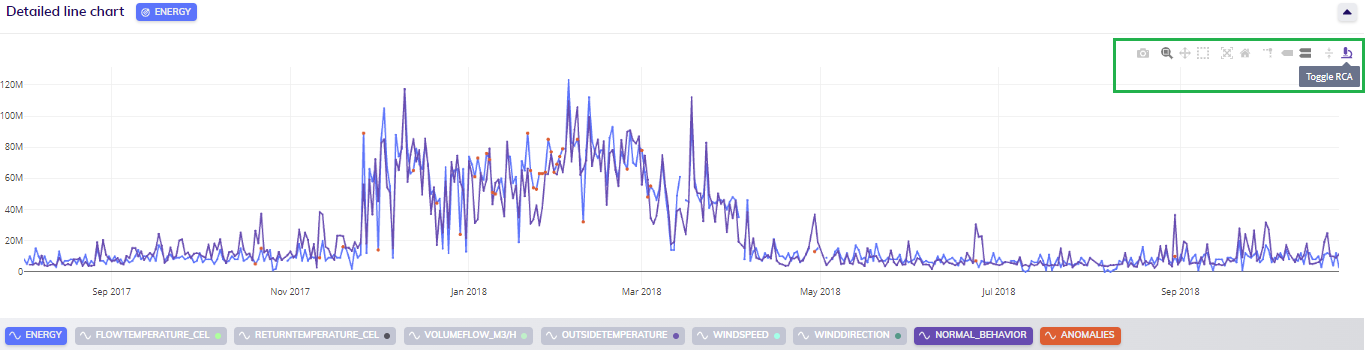
To start performing RCA, the user should toggle the RCA icon ![]() in the actions at the top right of the detailed line chart. It visualizes that the RCA mode is active by turning purple (instead of grey).
in the actions at the top right of the detailed line chart. It visualizes that the RCA mode is active by turning purple (instead of grey).
Then, RCA can be invoked by clicking on a point for which TIM should calculate possible root causes.
Situation 1
The next step is to click on the first anomaly of the analyzed situation. It is recommended to start with the first, to avoid being affected by the previous anomalies, allowing the user to see what was behind the change from a normal to an anomalous state. After clicking, a line selection visual pops up - select anomalies.
Doing so will trigger the root cause analysis process, after which the results will appear.
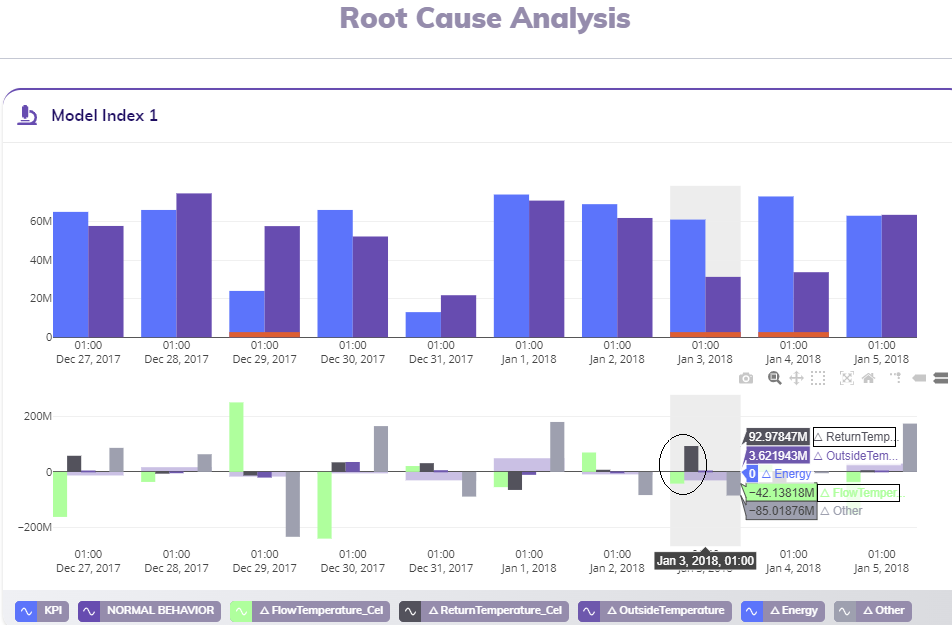
In these results, it can be observed that the model expected a significant decrease in heat consumption (from January 2nd to January 3rd), but this did not happen. At the bottom of the RCA graph, the legend shows which influencers have the highest contribution to this expected change. This points in the direction of looking into the recent course of the predictors FlowTemperature and especially ReturnTemperature to see what occured before the anomaly happened.
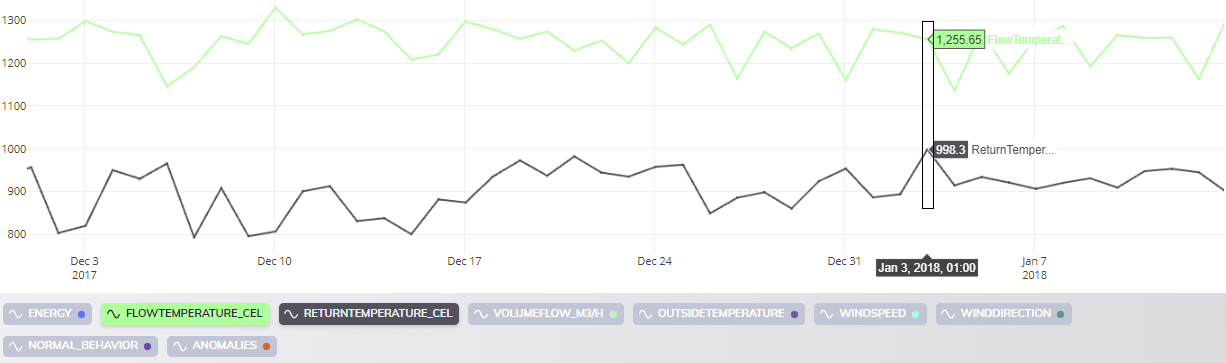
Going back to the initial line chart that visualizes the dataset, it can be seen that FlowTemperature is high, indicating the building has to be properly heated on January 3rd. At the same time however, ReturnTemperature is very high for the given circumstances, meaning that the building was not heated as required. The warm water should flow in and warm the building, resulting in a significant decrease in its temperature, which not happen.
Thus, the reason why ReturnTemperature remained this high has to be investigated. There does not seem to be a problem in the data itself, so the reason for the anomaly could be an issue with the radiators or a loss of system pressure. Based on this analysis, an experienced domain expert can identify the problem right away or exclude possibilities that did not cause the anomaly, and navigate the inspection team to the component(s) of the system that must be checked.
Situation 2
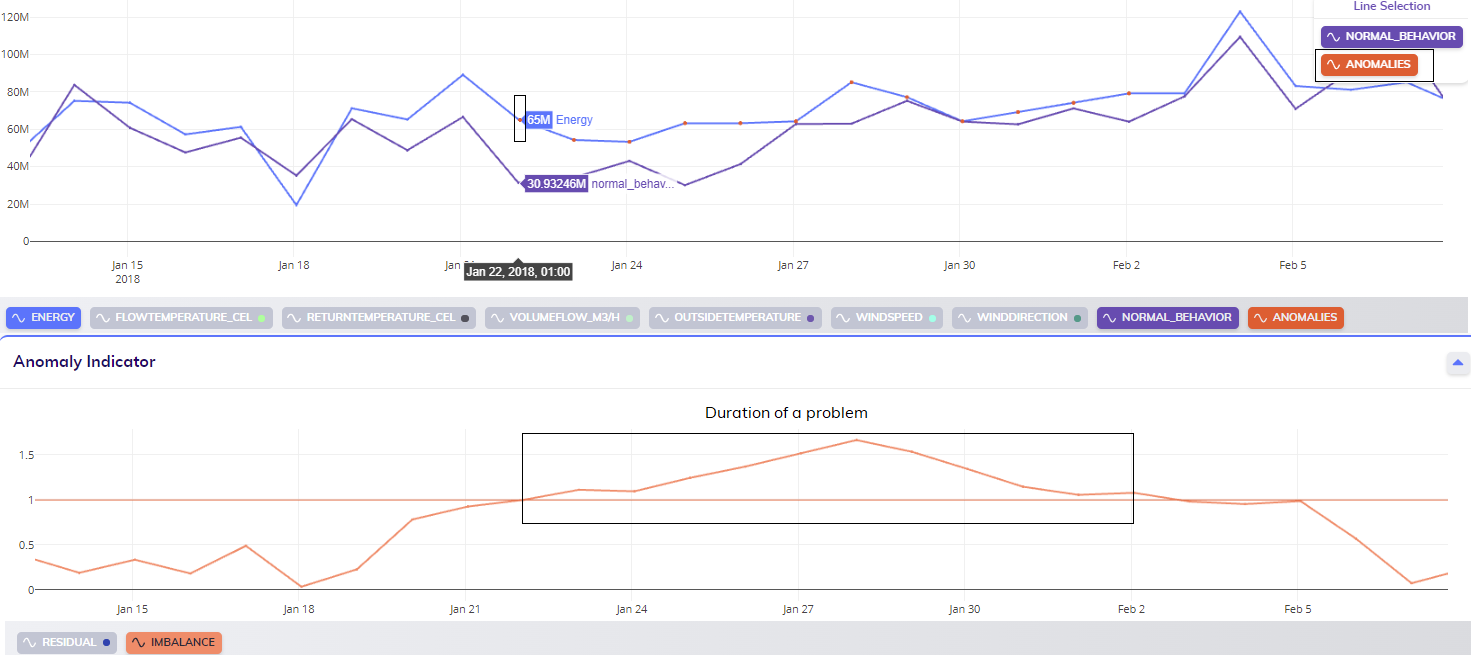
On to the second anomalous situation to analyze: based on the anomaly indicator(s), this problem is of a longer duration, starting on January 22nd. Clicking on this point is allows the user to analyze what has triggered this series of abnormalities.
Doing so will again trigger the root cause analysis process, after which the results will again appear.
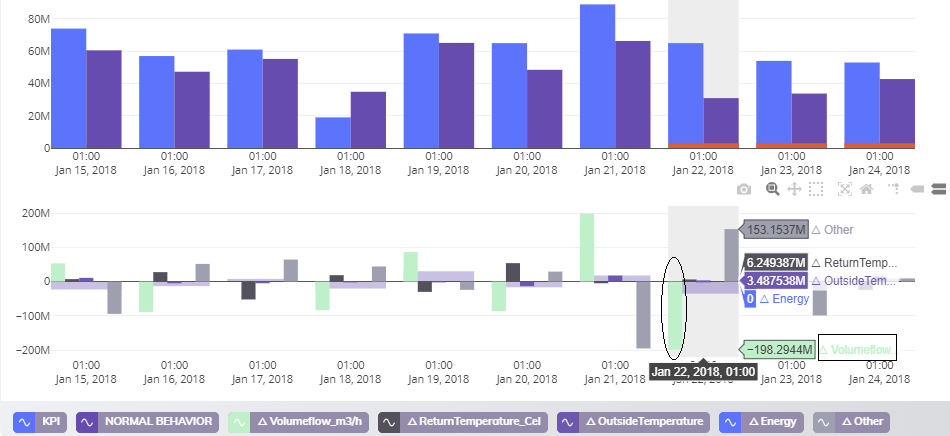
In this case, the problem is that the expected heat consumption is less than the actual heat consumption; the heat consumption is consistently underestimated for about a week. At the bottom of the RCA graph, in the legend, is again visualized which influencer(s) contributed to this underestimation the most. This leads the analyst to look at the recent course of the volume of water flowing through a pipe into the building (as contained in the influencer Volumeflow).
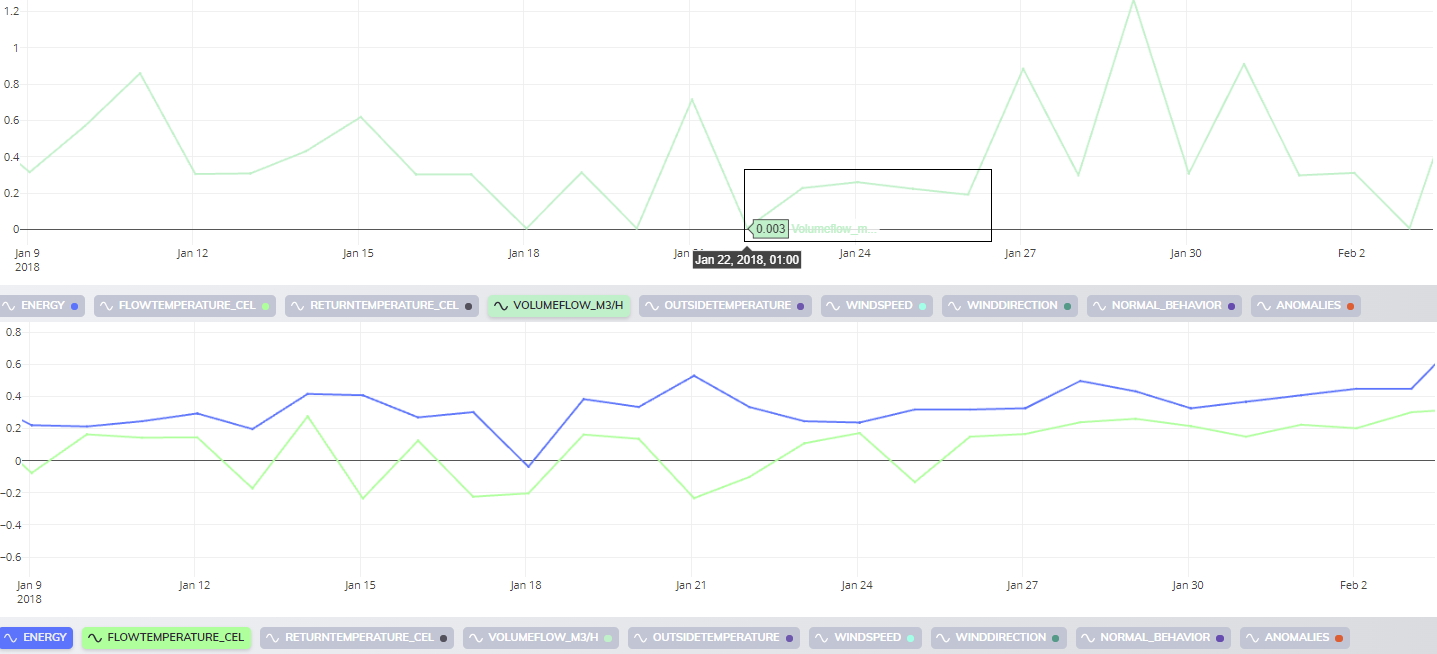
The detailed line chart of the dataset itself shows that VolumeFlow dropped and stayed on low volumes for a longer time, suggesting that the building does not have to be heated as much as in recent days. On the contrary, FlowTemperature is high, meaning that the heat consumption did not decrease. Taking all this into account, the water flow should not have such low values.
Therefore, the reason why VolumeFlow stayed so low over this period has to be investigated. There does not seem to be a problem in the data, meaning that the cause could be leaks or ruptures in the pipe. Based on this analysis, an experienced domain expert can identify the problem right away or exclude possibilities that did not cause the anomaly, and navigate the inspection team to the component(s) of the system that must be checked.
Situation 3
The problem of the third situation arose out of nothing during a non-heating period based on the anomaly indicator. Clicking on the corresponding point (on June 23rd) enables the user to explore what initiated this exception.
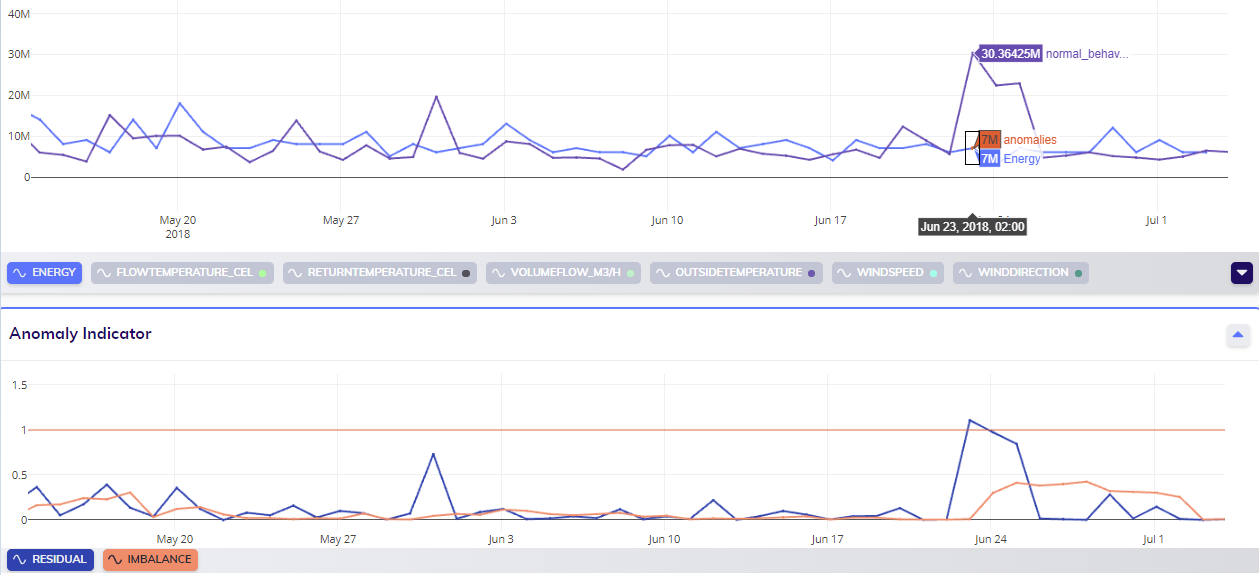
Doing so will again trigger the root cause analysis process, after which the results will again appear.
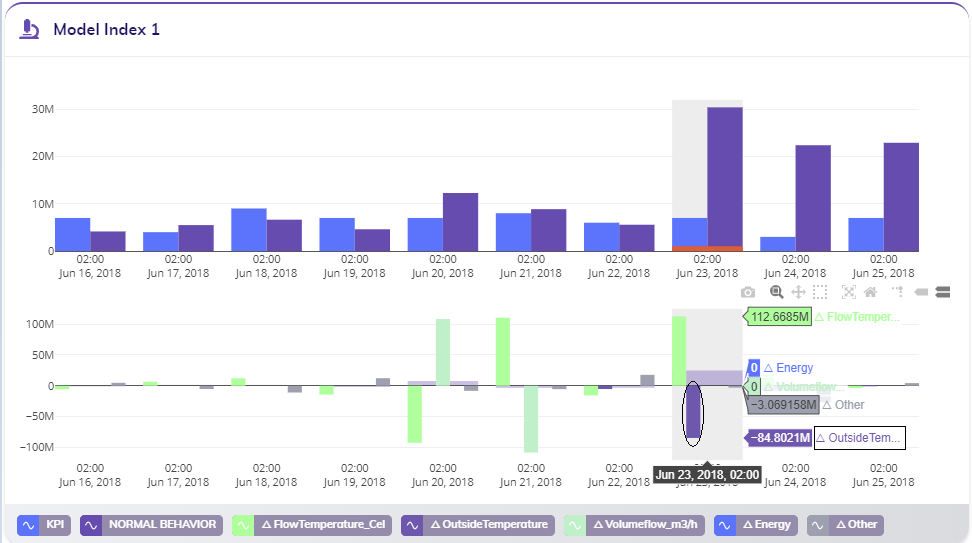
In this situation, the value of the estimated heat consumption suddenly raised; such a high heat consumption is very improbable during summer time. At the bottom of the RCA chart, a significant change in the outside temperature can be noticed. However, in the non-heating period, this does not play an essential role in normal behaviour changes (see the zero value contributions of outside temperature on the normal behavior model from June 16th to June 21st). This guides the analyst to examine the recent measurements of the outside temperature (as contained in the influencer OutsideTemperature).
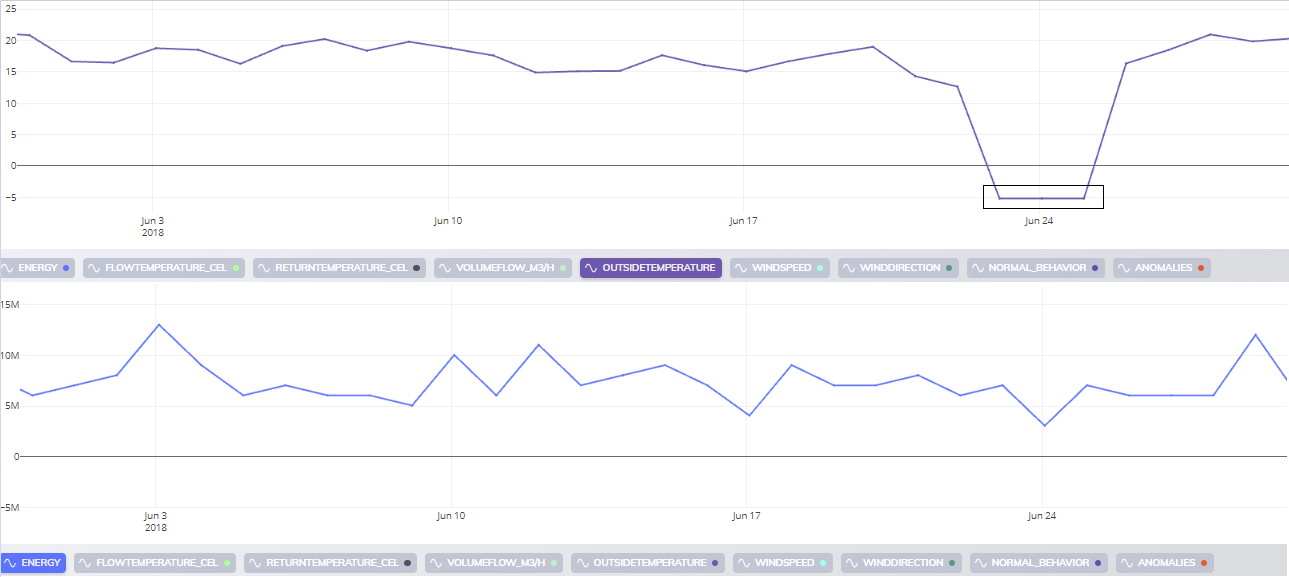
The detailed line chart of the input data shows that OutsideTemperature unexpectedly fell to a very low (even negative) temperature and remained that low for multiple days. Heating a building at such low temperatures would increase heat consumption, which did not happen.
In this case, the cause of the problem is likely in the data, suggesting that for example a thermometer does not work correctly, or data measurements were incorrectly transferred to the database. Based on this analysis, an experienced domain expert can identify that the problem is only in the data, meaning there is no need to send the inspection team, which is also valuable information.