Manufacturing Production Line
Problem Description
This data comes from an actual production line near Detroit, Michigan. The goal is to do a real-time check of the line's output dependent on the various input data - meaning models are implemented for anomaly detection (compare model forecasts to original outputs in real-time). The track is a high-speed, continuous manufacturing process with parallel and series stages.
As material efficiency is of vital importance, it is crucial to investigate: "Is the line's output proper under given input data? " It highlights the importance of continuous monitoring of the production line. Thus the task was to automate data interpretation to deliver alerts in case line's output does not match input data.
Understand the problem also means to know the data.
- The data comes from one production run spanning several hours. Liveline Technologies has a large quantity of this type of data from multiple production lines in various locations.
- In the first stage, Machines 1, 2, and 3 operate in parallel and feed their outputs into a step that combines the flows. The output from the combiner is measured in 15 locations. These measurements are the primary measurements to check.
- Next, the output flows into a second stage, where Machines 4 and 5 process in series. Measurements are made again in the same 15 locations. These are the secondary measurements to check.
- Each output has 41 influencers
- high sampling rate - 1 sec. data
Based on these facts concerning scenario and data, it is evident that to tackle this problem automatic, real-time, large-scale solution is a must.
As written, in this competition were provided data only from one production run and we chose one of the 15 primary line's outputs for anomaly detection. To read more about this problem, please visit kaggle
Data Recommendation
The production line output is dependent on different material properties like pressure and ambient conditions like temperature and all possible metered variables of a given machine. Also, every production line can have its specificities. In general, for anomaly detection tasks with defined KPI(line's output) - like this one, we recommend to include predictors, that are in a relationship with the given KPI. The more influential variables are at your disposal, the better the estimation of normal behavior you get.
You are working with data at your disposal, concerning what is your goal, taking into account other circumstances. A good illustration for that is the following : If you have a wind turbine that can turn the head so that the blades face the wind through wind direction sensor combined with a motorised head moving mechanism, then wind direction has almost no influence on produced energy of a turbine. In reverse, if there were no such mechanism, wind direction would be crucial to do reasonable anomaly detection.
In this case, the KPI is the line's output. As predictors were available 41 variables measured on Machine 1, Machine 2 and Machine 3.
TIM Setup
As the problem requires an automatic anomaly detection solution, we want to highlight that to build a reasonable model there is only one parameter to be adjusted. The period in which you build your model and detect anomalies is the same in this case(all data), as the data comes from one production run spanning only several hours. Sensitivity to anomalies is calculated automatically, meaning we do not know which of the points are normal or abnormal - unsupervised anomaly detection. Data have one-second sampling rate, and always when new data point came to the database, all predictors are available - it is the default.
Regarding math setting, we do not include offsets of KPI/target - Stage1.Output.Measurement13.U.Actual, as we want to detect anomalies only following the material properties and different metered values of the machines. In case you want to play with math settings, you can adjust them manually. Documentation for Routine definition and Math Settings you can read in Anomaly Detection section.
Demo example
This section serves as an instruction on how to replicate this problem with TIM Studio and TIM Python Client. Download the data by clicking on the download link.
Target
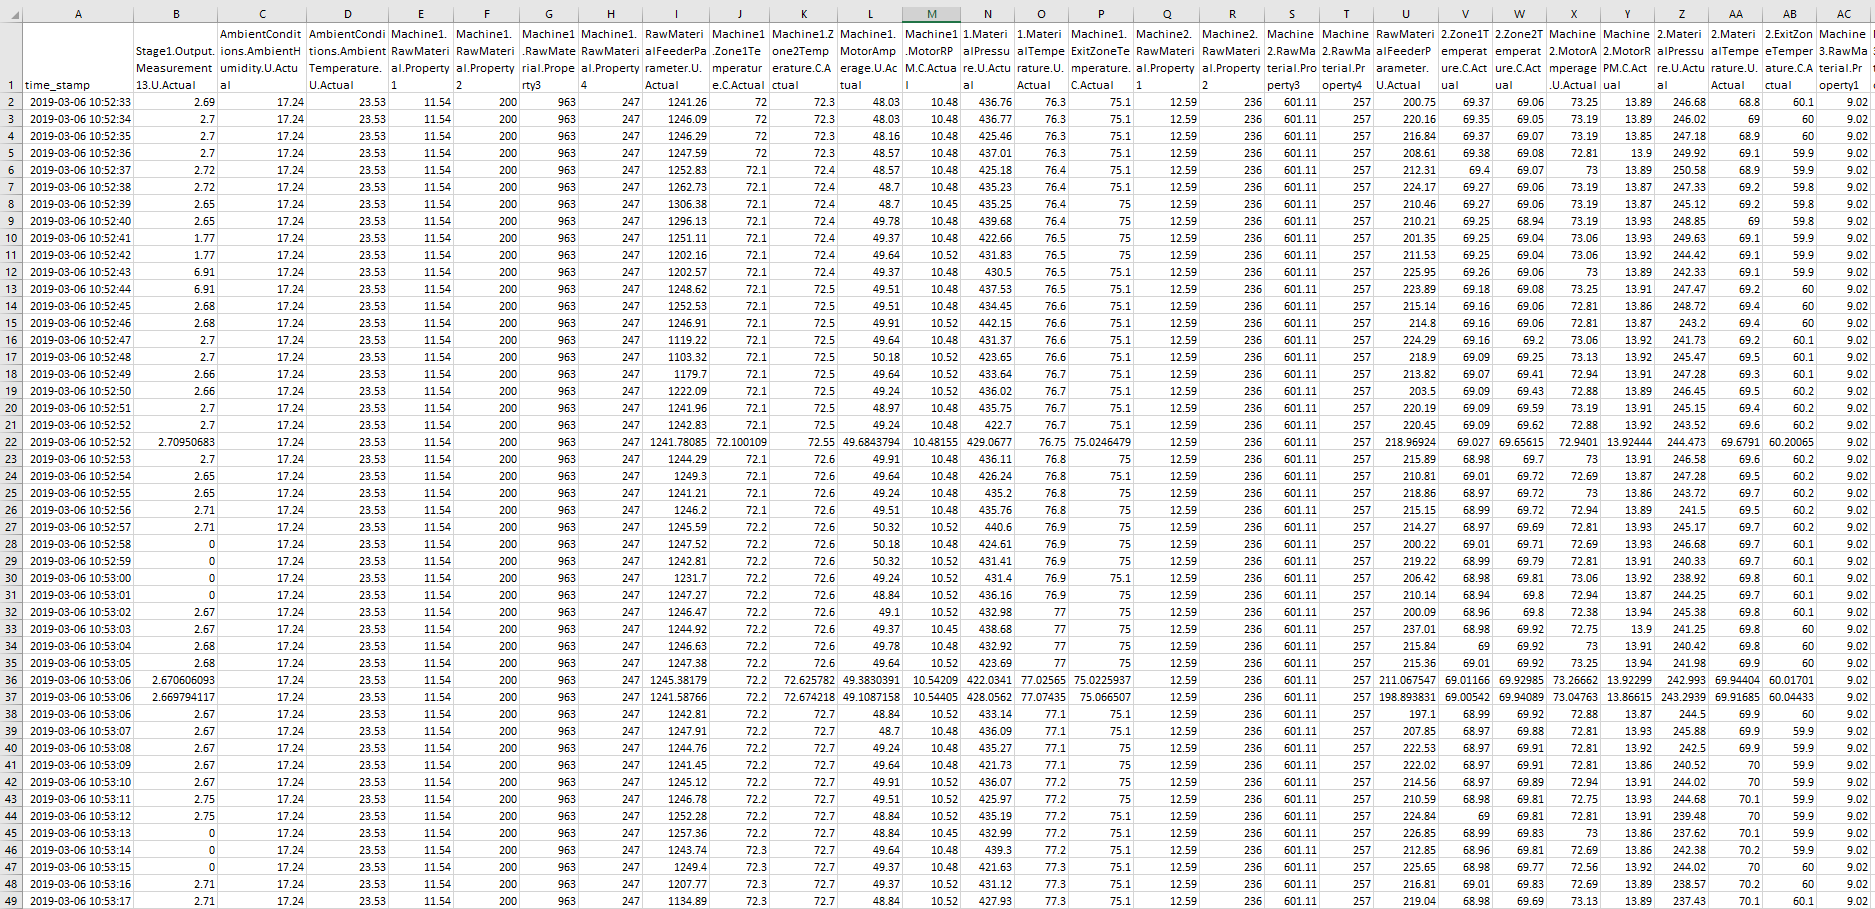
Data used in this example are assembled from the production line near Detroit. One of the outputs of this production line is our KPI/target. It is the second column in CSV file, right after column with timestamps. In this case, the name of the target is "Stage1.Output.Measurement13.U.Actual". The data has a one-second sampling rate.
Predictor candidates
As predictors, we use all predictors that were given by competition. There are different material properties like pressure and ambient conditions like temperature and all possible metered variables of a given machine. Thus, for both model building and detection, historical actuals of this data are used. As the same data would be available in the operational mode, it is a representative simulation.
Data used in this example are from 2019-03-06 10:52:33 to 2019-03-06 14:47:20
Detection scenario
We simulate the real-time detection scenario. Is such a situation, we often wish to make detection as often as new data comes into a database. As both, KPI and predictors are updating every second; we build a model that can do detection every second. It is up to you how often you will do detection; for example, you can always gather data of last-minute and do screening, you do not have to do it each second. Thus, this scenario does not need to be specially configured; all settings regarding data updates and availability are TIM defaults.
Model building and validation
In this case, both model building and detection are done on the whole dataset, meaning the period from 2019-03-06 10:52:33 to 2019-03-06 14:47:20. Please, bear in mind, detection must not be done for the whole period as a model always requires data for calibration when new data range begins; The results -anomaly indicator is divided into multiple data ranges as data are gappy.
Demonstration
TIM Python Client
After Installation you can use use the notebook and credentials form to run the experiment using TIM Python Client.
It is also possible to view the notebook.