Wind Turbine
Problem Description
Wind turbines have become progressively influential as the share of energy production and the infiltration of wind energy into power systems are steadily increasing.
As the stoppage of energy production leads to significant production losses, these turbines must operate as smoothly as possible. This highlights the importance of operations and maintenance, especially the role of health monitoring. Continuous monitoring of wind turbine health using anomaly detection improves turbine reliability and efficiency reducing maintenance and wind power costs, so that turbine maintenance and repairs can be made at the right time before they reach a catastrophic stage.
The task was to automate data interpretation to deliver actionable maintenance recommendations. In concrete, there were 3 wind farms with 41 wind turbines in overall, while KPI for each of them was produced energy of a given wind turbine. In case of suspicious behavior of any turbine they wanted to get an alert, so they know in real-time when something bad happening. It allows them to do inspections in the right wind farm, of a proper turbine, at the right time.
Data Recommendation
The power output of a wind turbine is dependent on the efficiency of the blades, gear assembly, alternator/dynamo, as well as wind speed, wind direction and wind consistency. Also, the taller wind turbine the greater energy produced since wind speeds are greater at higher altitudes.
In the anomaly detection tasks with defined KPI - like this one, we recommend to include predictors, that are in a relationship with the given KPI. The more influential variables are at your disposal, the better estimation of normal behavior you get. In fact, you have to work with what you have with regard to what is your goal, taking into account other circumstances. A good illustration is wind direction.
If you have a turbine that can turn the head so that the blades face the wind through wind direction sensor combined with a motorized head moving mechanism, then wind direction has almost no influence on produces energy of a turbine. In reverse, if there was no such mechanism, wind direction would be crucial to do reasonable anomaly detection. In this case, the turbines had this mechanism, so wind direction was not needed. Also, they do not have data about the efficiency of the blades or the condition of an alternator and gear assembly. So, our predictor was only wind speed. Every time they got an alert, they knew wind turbine is not working properly which allows them to do inspections in the right wind farm, of a proper turbine, at the right time.
TIM Setup
In this case, the only thing that was needed to specify was the period on which you want to build your model and period on which you want to detect anomalies. Data have 10 minutes grid and always when new data point came wind speed is available. Of course, there are cases when you have predictors with other updates and availabilities, then you have to adjust them correspondingly. Also, when you are not satisfied with math settings, you can change them manually. Documentation for Routine definition and Math Settings can be found in Anomaly Detection section.
Demo example
This section serves as an instruction on how to replicate this problem with TIM Studio and TIM Python Client. Download the data by clicking on the download link.
Target
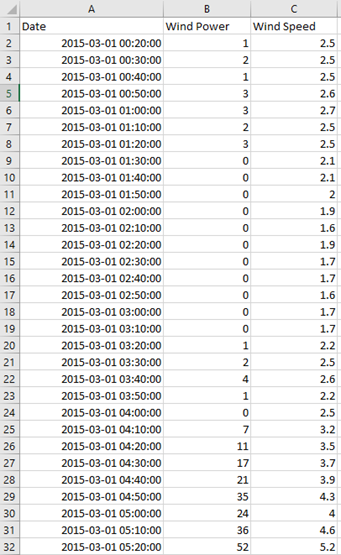
Data used in this example are assembled from a wind turbine in Netherlands. Production of this wind turbine is our KPI/target. It is the second column in CSV file, right after column with timestamps. In this case name of the target is Wind Power. The sampling rate of the data is 10 minutes.
Predictor candidates
As a predictor, we use wind speed. In this demo, we are using historical actuals for both model building and out-of-sample detection. Data used in this example are from 2015-03-01 00:20:00 to 2016-03-01 00:00:00
Detection scenario
We simulate the real-time detection scenario. Is such a situation, we wish to make detection as often as new data comes into a database. As both, KPI- Wind Power and predictor- Wind Speed are updating every ten minutes; we do a detection every 10 minutes. Thus, this scenario does not need to be specially configured; all settings regarding data updates and availability are adjusted by default.
Model building and validation
Model is built using a range of 2015-03-02 00:00:00- 2015-10-02 23:50:00.
Out-of-sample detections are made at range 2015-10-05 00:00:00- 2016-02-28 23:50:00. In this demo data set, out-of-sample validation is performed using historical metered values of wind speed.
Demonstration
TIM Python Client
After Installation you can use use the notebook and credentials form to run the experiment using TIM Python Client. It is also possible to view the notebook
TIM Studio
This section covers the use of TIM Studio to solve the challenge described above.
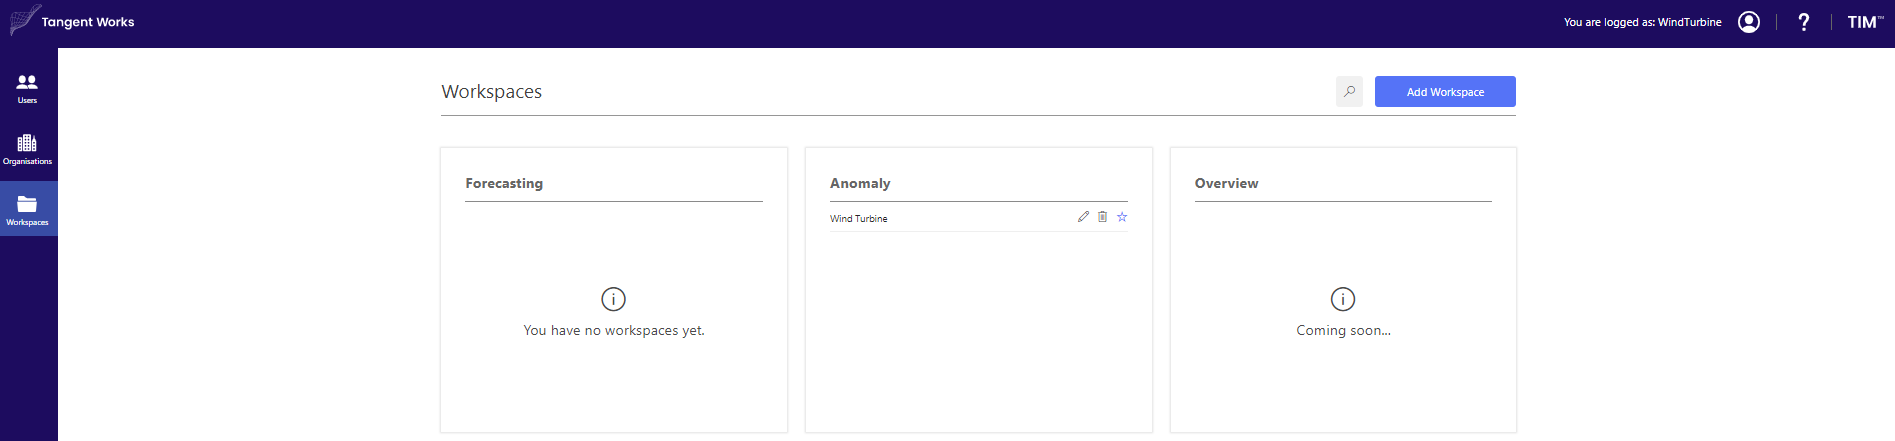
Select workspace
In the Workspaces screen, select the workspace in which the dataset should be added. If there is no available workspace, create one by clicking "Add Workspace". In this solution template, the workspace called "Wind Turbine" is used.
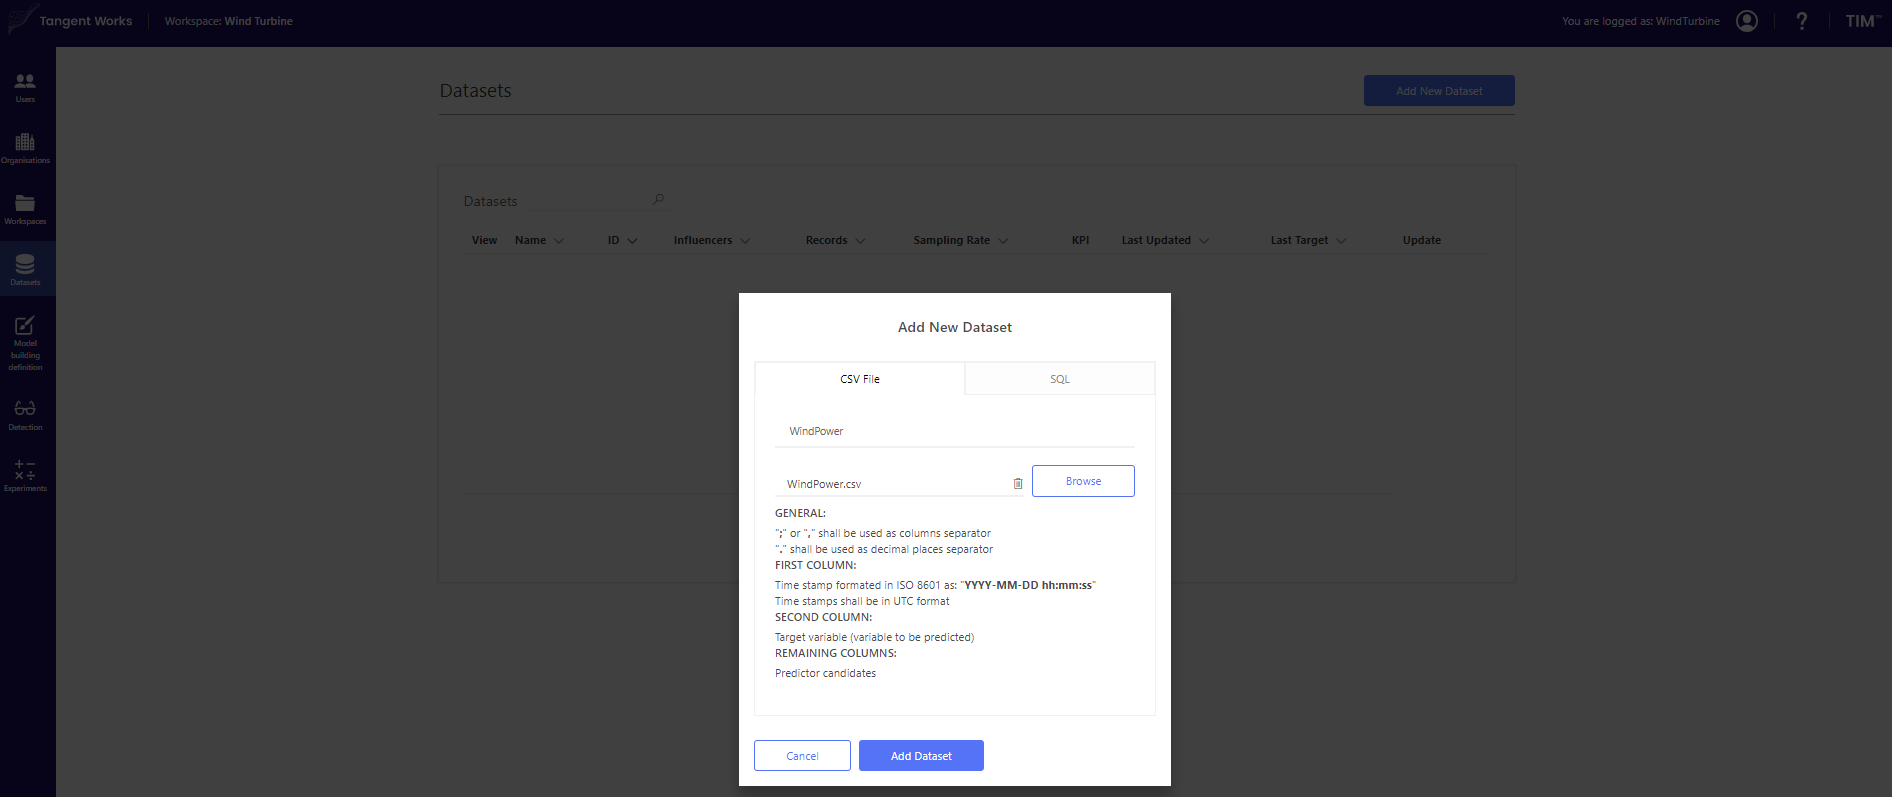
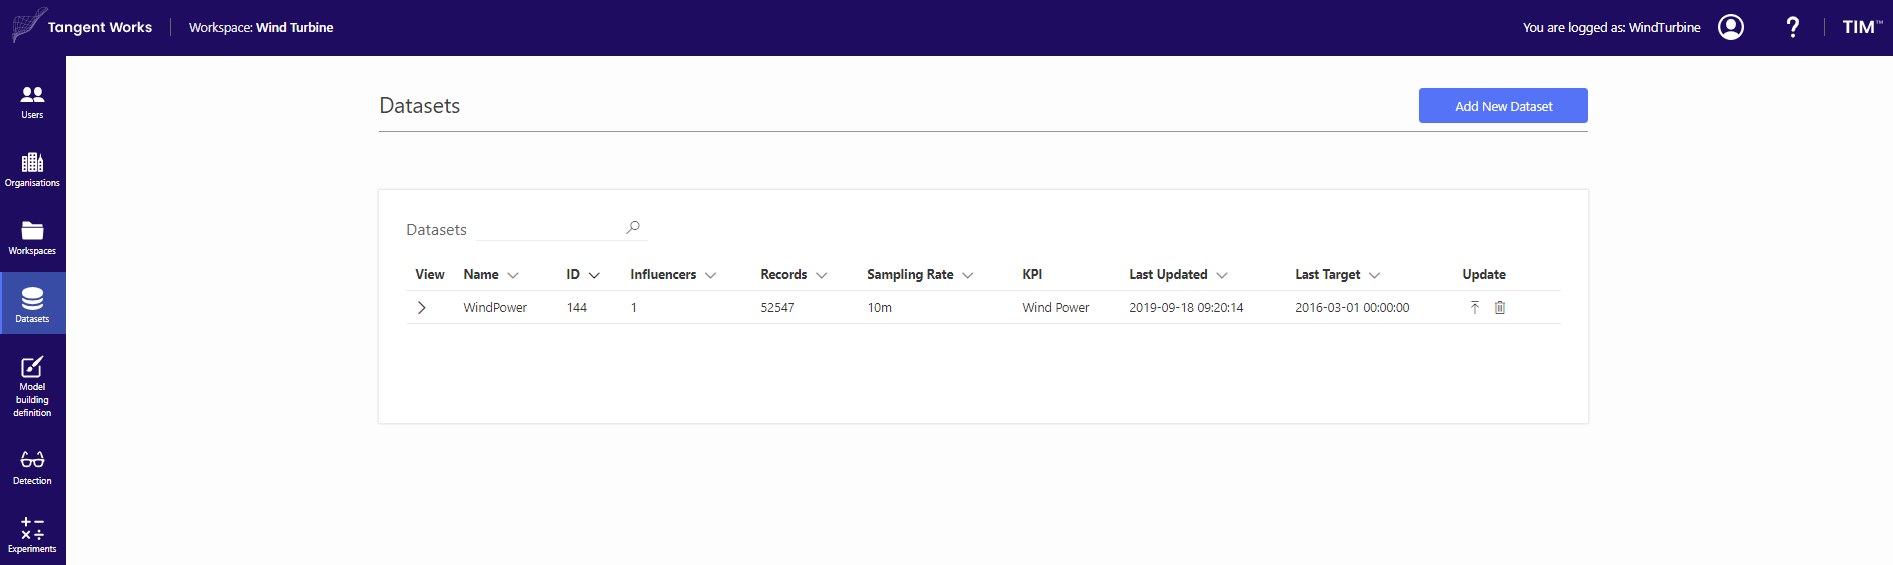
Upload data
In the Datasets screen click on Add New Dataset. Stay in the tab CSV-File and insert name of the dataset. In this example, the dataset is called WindPower. Click "Browse" and select the dataset from the computer. Click "Add Dataset" to confirm.
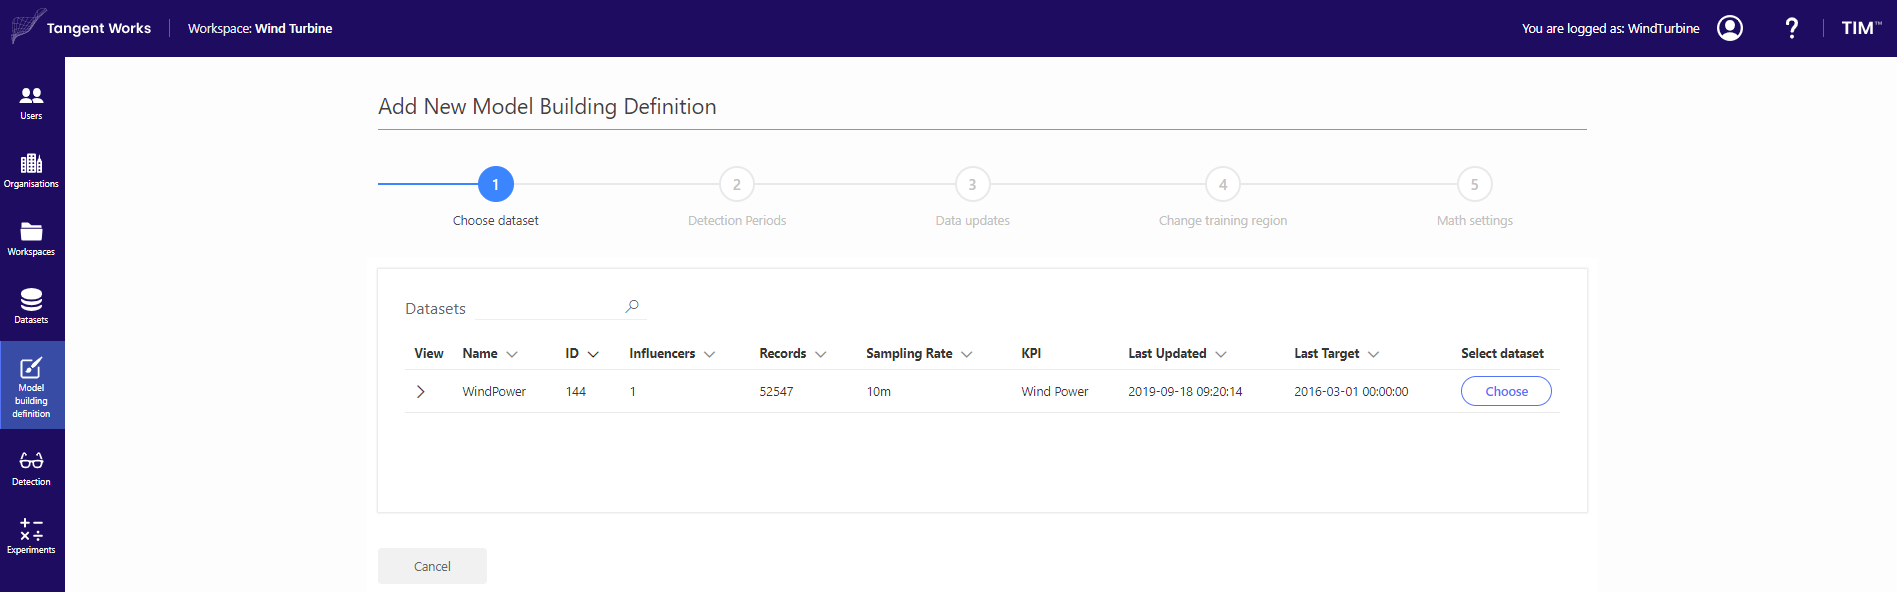
Model building definition
Go to the Model Building Definition screen in the panel on the left. Click "Add New Definition" and fill in the desired definition name. In this demo, the MBD is called WindTurbine_AD. In the next screen, select the dataset that was previously uploaded (WindPower).
In the next steps, you can define Detection periods, Data updates, Training region and additional Math settings. In this case, the only thing that was needed to specify was the period on which you want to build your model and period on which you want to detect anomalies. Thus, proceed to step 4. Training region is from 2015-03-02 00:00:00 to 2015-10-02 23:50:00. You can choose this period by using Data from and Omit in a step Change training region.
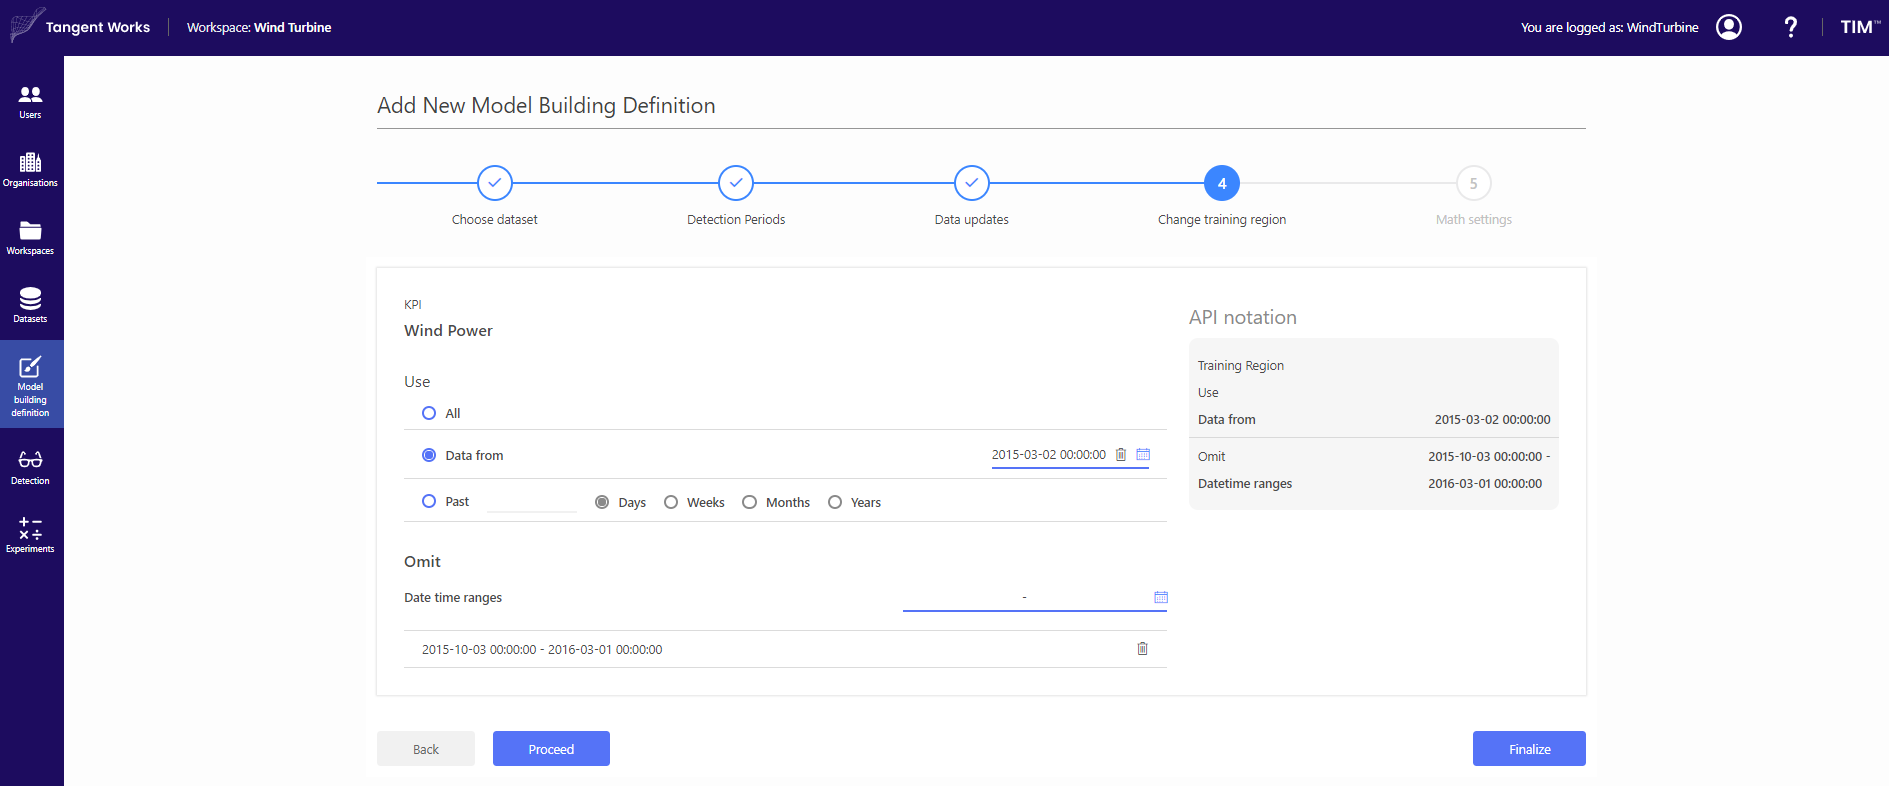
Then, click "Finalize" to complete the model building definition.
Of course, when you need to adjust availabilities of your data or you are not satisfied with math settings, you can change them manually. Now, your Model Building definition is stored and ready to build a model.
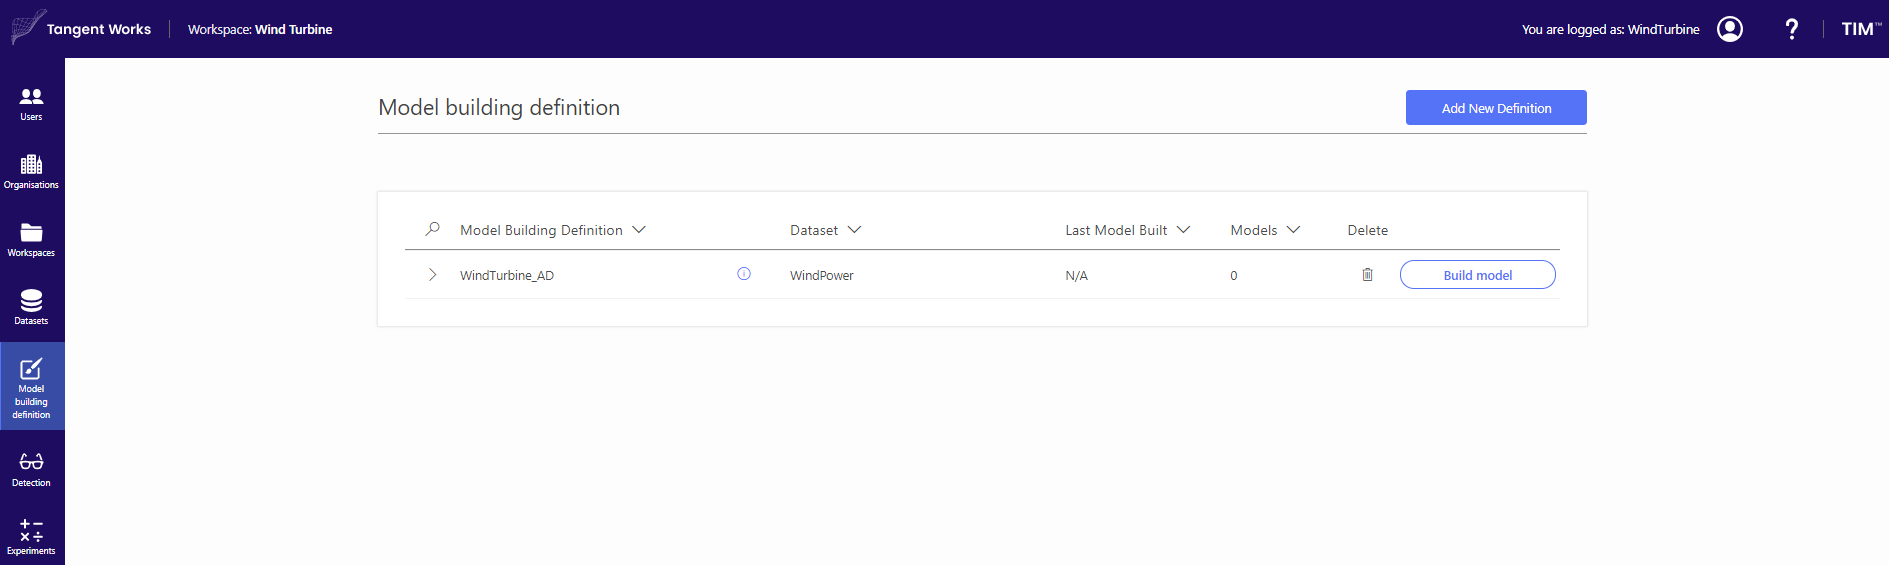
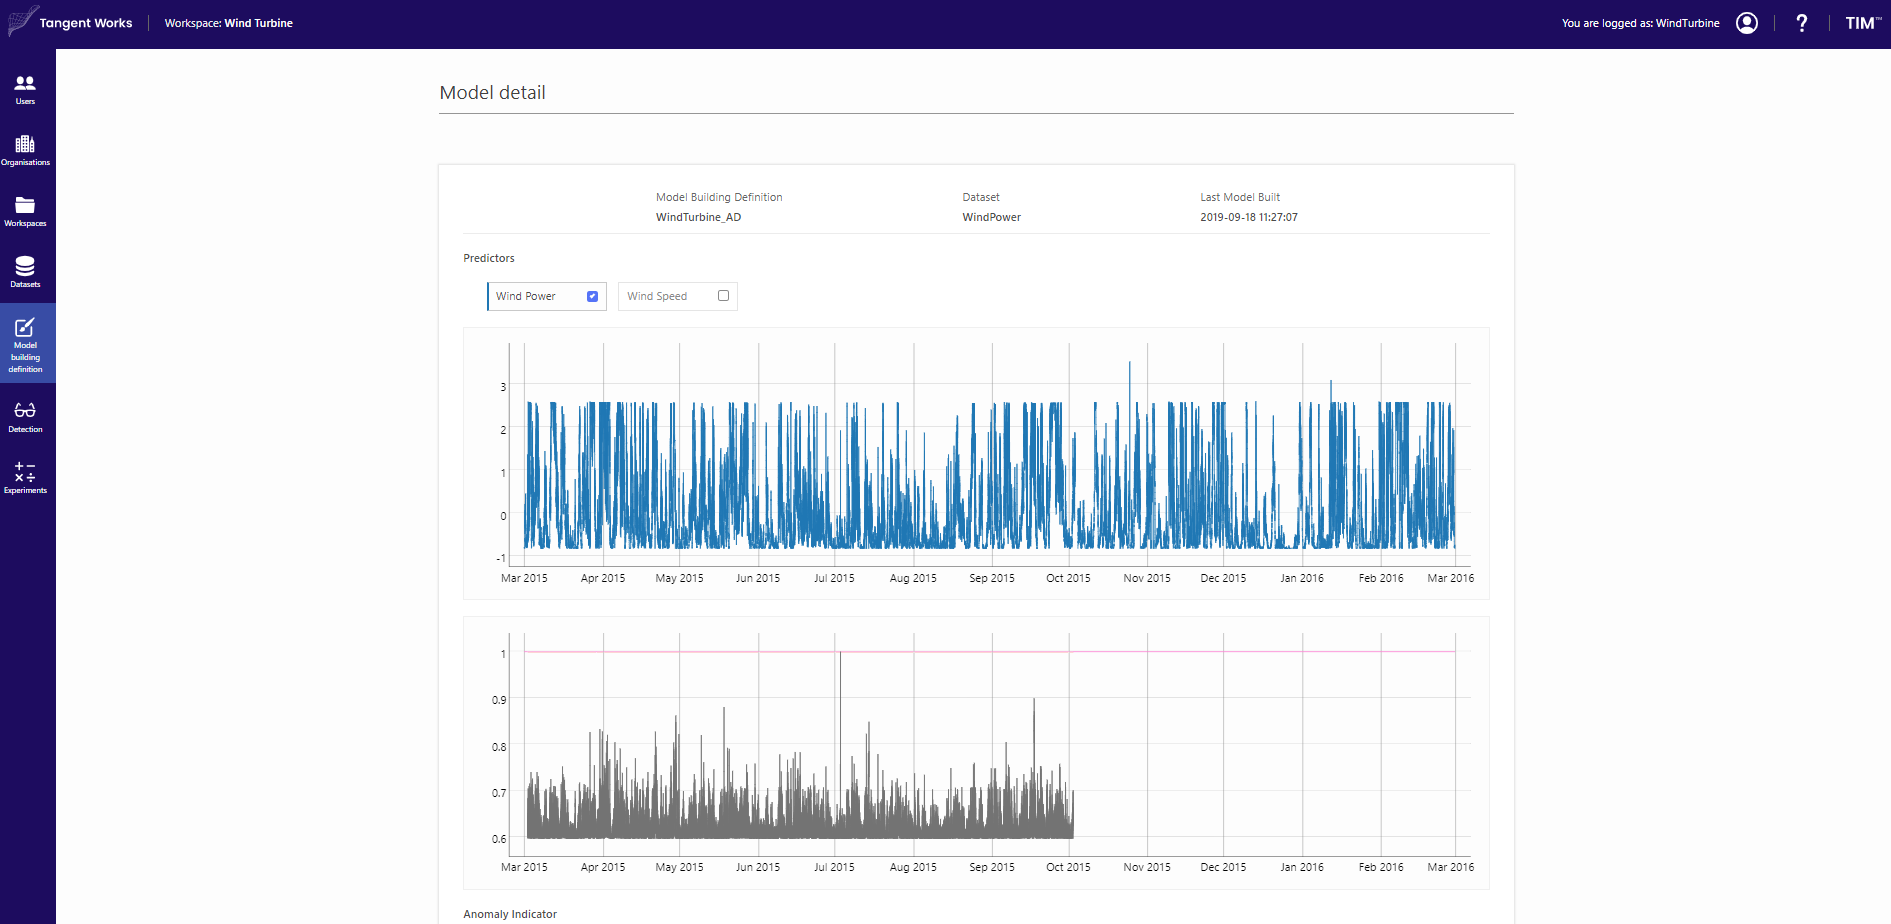
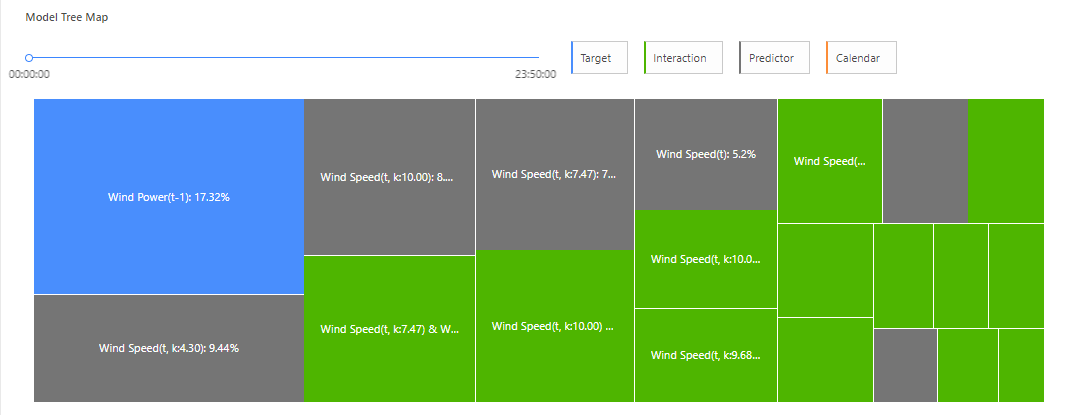
Click "Build Model", and after finishing click on the model detail. The in-sample detection with Anomaly indicator as well as the Model treemap become visible.
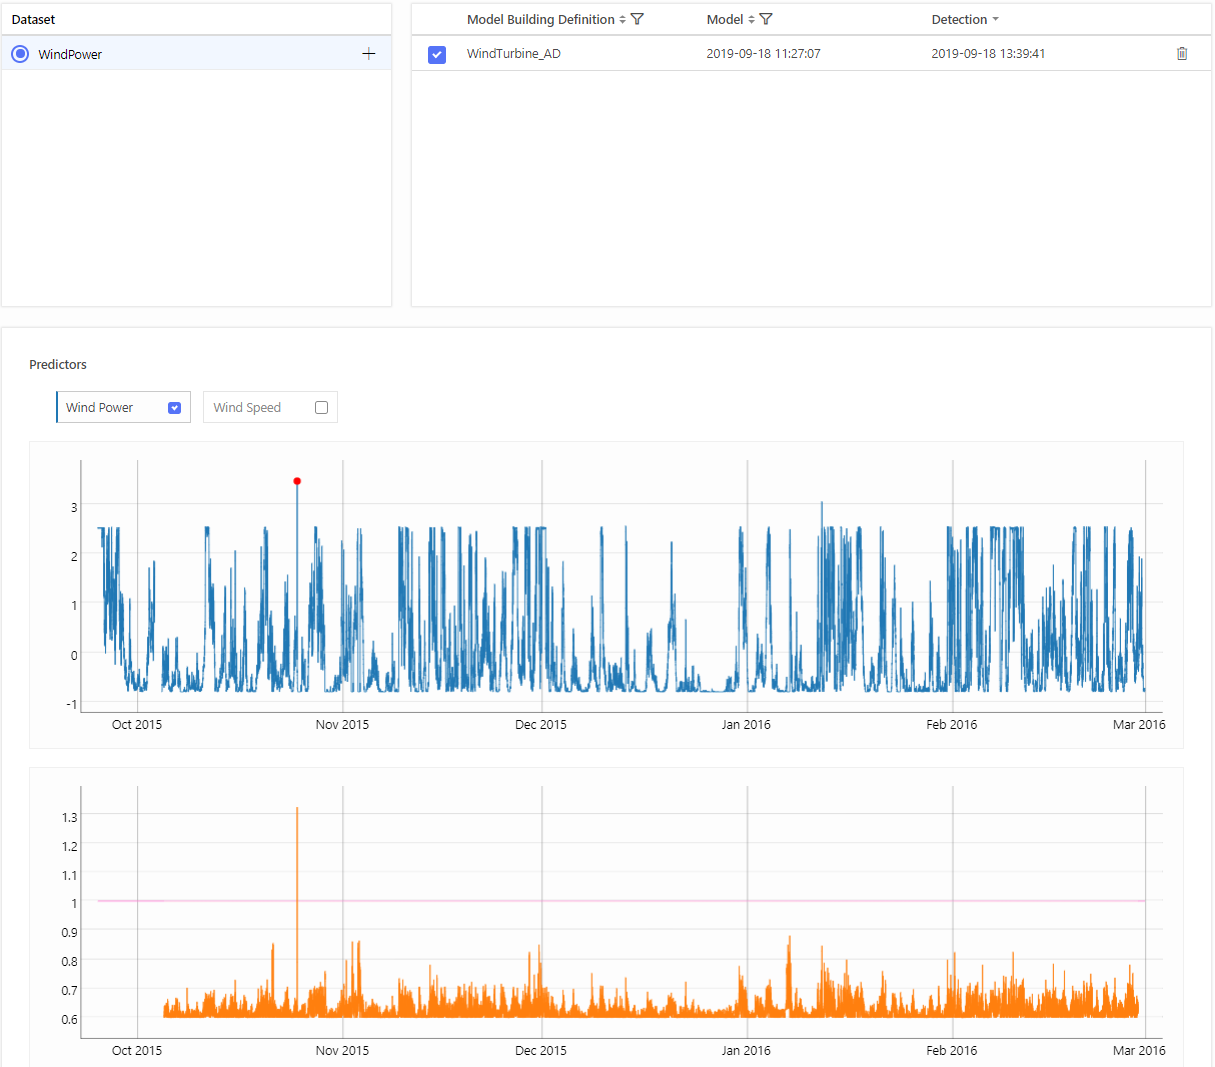
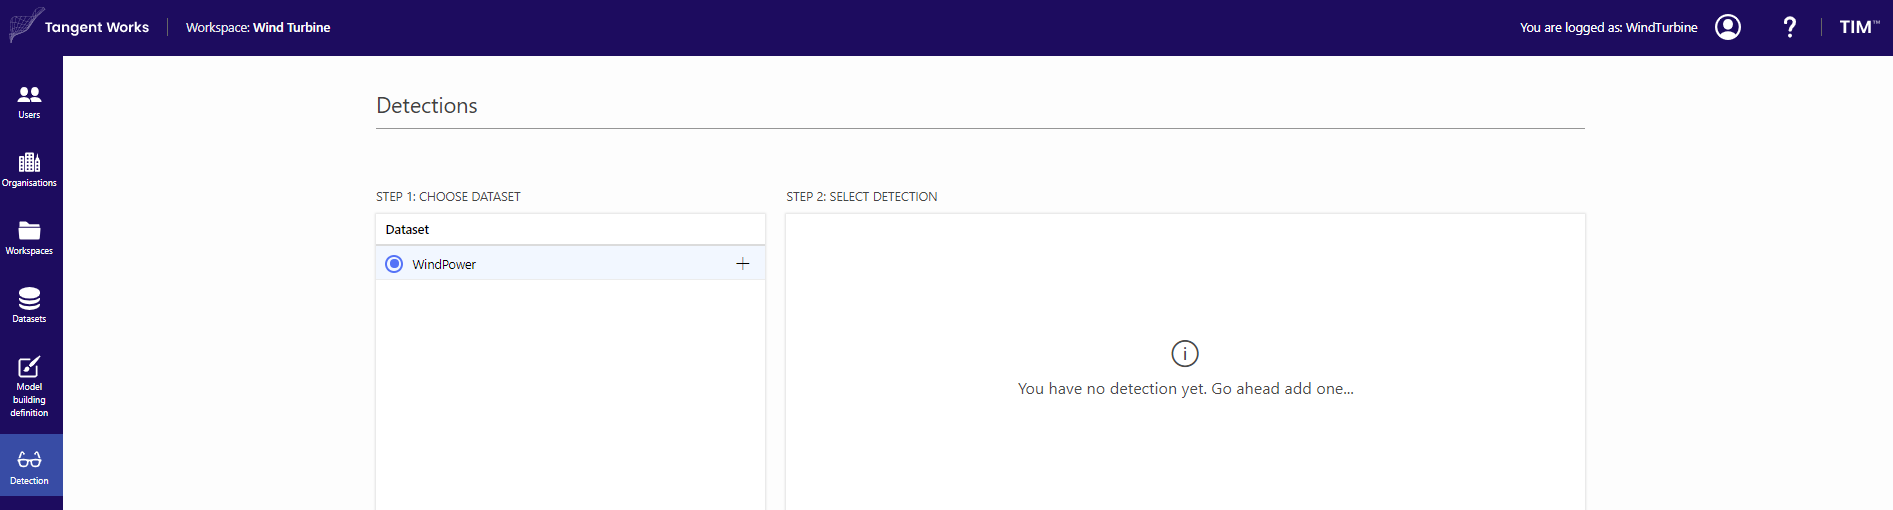
Detection
The last step is to create detection. Click + to create a new one.
Then choose a corresponding model building definition, model and detection ranges. In this case, out-of-sample detections are made at range 2015-10-05 00:00:00- 2016-02-28 23:50:00
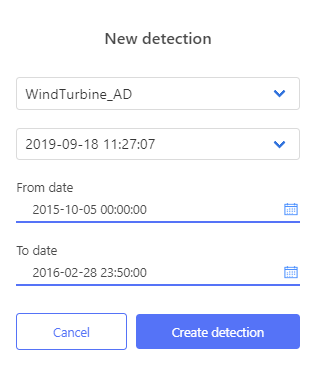
Created detection is stored and visualised.