Best Practices
This section serves as a guide for using TIM Detect. By reading it, a user should be able to get the best possible results and get their experiments running as smooth as possible in the most appropriate setup for their problem. Thus, such results are ready for fair evaluations and bring confidence in what TIM Detect can offer.
The following sections reveal what can impact the performance of the results.
Data
Data preparation
As data are fundamental in Machine Learning, they are the first thing a user should care about. TIM Detect accepts time-series data, which can be any numerical data recorded over time in a sequential order. All variables (columns) that could help to resolve the anomaly detection problem should be included. Additionally, enough observations (rows) should be included to allow the model to model what is 'normal'. What constitutes 'enough' differs from domain to domain and depends on the granularity of the data. It is recommended to prepare as much data as is available, as this enables experimenting in different ways before selecting the right model for the use case.
Time-series data are dependency-oriented data with the assumption of temporal continuity. In short, there are often causal relationships between variables (columns) meaning that the variables cannot just be treated independently. This has consequences on how an anomaly detection problem involving time-series data should be approached. The following two sections describe the two approaches supported by TIM Detect: a kpi-driven approach and a system-driven approach.
KPI-driven approach
TIM Detect's kpi-driven approach requires the selection of a KPI. This section describes the reasons for this, advantages of selecting a KPI and problems where doing so is fitting.
The selection of one or more KPIs (depending on the complexity of the problem) together with the assigning of influencers can allow TIM to figure out what the normal behavior of the given KPI is, and thus whether the given KPI behaves normally given its circumstances (influencers).
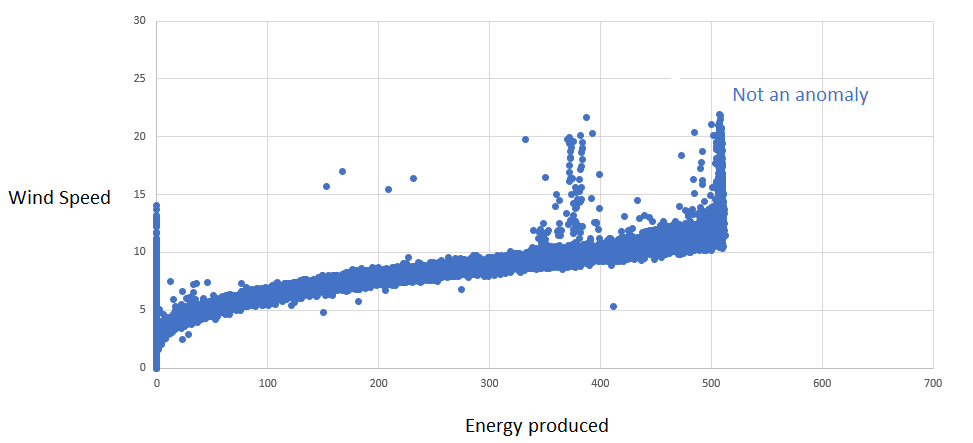
Imagine a simplistic example where the energy produced by a wind turbine is dependent on wind speed; there is a causal relationship. The goal is to find out whether the amount of energy that is produced is appropriate for the given wind speed.
A scatter plot of the data looks as follows:

The goal of the example is to figure out whether the green point is an anomaly or not. Let's take a look at the impact taking the causal relationship into account can have.
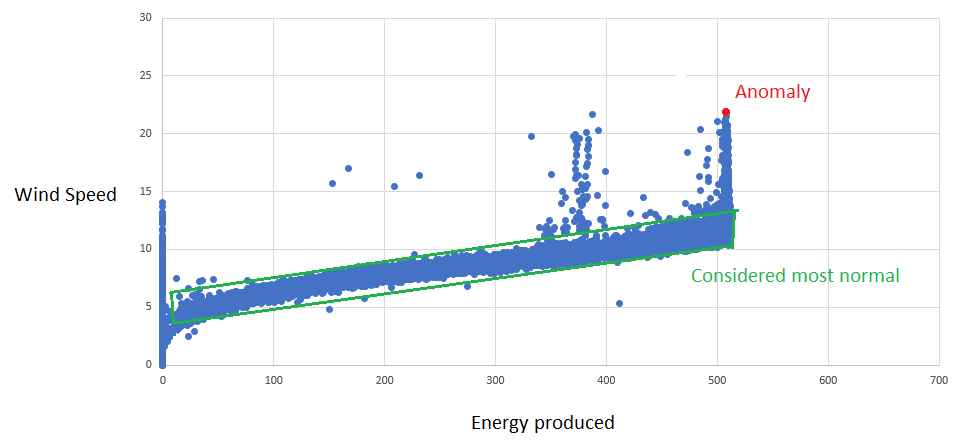
Taking into account the causal relationship:

This approach allows TIM Detect to learn the real relationship between produced energy and wind speed. TIM is able to detect there is a nonlinear relationship, understanding that wind can have a very high speed without any increase of produced energy.
This approach is applicable for multidimensional data with relationships between columns.
Ignoring the causal relationship:

In this case the energy produced and the wind speed are treated independently; the problem is viewed from a distribution perspective.
This is applicable for multidimensional data, where columns are not affecting each other. As a more appropriate example, imagine a wind farm with 10 wind turbines of the same type, having energy produced from each of them. As they are located in the same place, we can suppose the energy production should be similar. For such a case, an approach with no defined KPI and without looking at causal relationshipt would be the right one.

KPI selection
The selected KPI should be the variable/column on which anomaly detection should be performed, representing an output of a process (for instance a component of a machine). In the case of a complex system, it is recommended to select multiple KPIs as this can bring the ability to accurately identify the location of the problem (read more in Design of experiment)

Influencers selection
Influencers are chosen based on the selected KPI. They add context to the given KPI, which is vital for finding reasonable anomalies. Without the circumstances that are provided by influencers, it is not possible to responsibly decide whether a KPI value is normal or abnormal. TIM Detect can choose the influencers automatically, yet the best option is to only add those influencers that causally affect a KPI (it is not possible to differentiate between correlation and causation based on the data alone, a domain expert is needed for that).

System-driven approach
TIM Detect's system-driven approach does not require the selection of a KPI. Instead, this approach looks at the given data as its representation of a system, and detects anomalies affecting this system as a whole. Still, it is recommended to include all variables (columns) that can influence the problem and to include enough observations (rows) for the model building process to capture what 'normal' looks like for this system. Here too, what constitutes 'enough' differs from domain to domain and depends on the granularity of the data. So again, it is recommended to prepare as much data as is available, as this enables experimenting in different ways before selecting the right model for the use case.
Building period and its length
The quality of a model also depends on the observations and the amount of them entering the model building process. To build a good model for any problem, it is vital to include enough data that is able to portray what is normal. How much data this is differs from domain to domain, depending on the granularity, pattern and stationarity of the data.
In general, it does not hold true that more data means a the better model. If a domain expert can tell that a certain subset of the data is sufficiently describing normal behavior, there is no need to include more data in model building. In contrary, the model building will take up more time and may describe normal behavior worse (especially in cases where normal behavior changes over time).
Furthermore, if a user is aware of corrupted data, this data should not be included in the model building; otherwise, the model may be seriously affected.
Ratio of anomalies in training data
Given the ratio of anomalies the training data, the first decision to make is whether the anomaly detection approach, in general, is the right one for the problem at hand (see the table below).
| Anomaly detection | Supervised learning |
|---|---|
| Very small number of positive examples | Large number of positive and negative examples |
| Large number of negative examples | Anomalous and normal classes are balanced (at least 1:5) |
| Many different types of anomalies | Enough positive examples for algorithm to get a sense of what anomalies are like |
| Future anomalies may look totally different than the anomalous examples we have seen so far | Future positive examples similar to ones in building data |
Of course, in most cases, there is no label, meaning there is no available information of whether an observation is abnormal or not (unsupervised anomaly detection); still, the percentage of anomalies in the data should not exceed 5%.
In case it is known in advance which observations are normal ((semi-)supervised anomaly detection), the best option is to include only this data in the model building, so the process is not affected by abnormal points.
Data quality
Missing data
The model is built only by using data points (rows) with no missing values. Besides, the model is built on blocks of regularly recorded data (securing the offsets of variables always represent with the same delay). Whether a model is affected by missing values depends on the percentage of points with missing values and their disposition in the data. In general, as long as missing observations constitute less than 10% of the included data it shouldn't harm the quality of the model. Yet, if there are regularly missing values - for example every tenth data point has a missing value - TIM might not be able to even build a model, as there might not be a sufficiently long block of regularly recorded data.
In case the missing values significantly affect the quality of the model, there are three ways of solving this problem:
- consider filling in the missing data based on the characteristics of the data (for instance substitute data points from an earlier period),
- use TIM to define imputation
"normalBehaviorModel": {
      "imputation": {
        "type": "Linear",
        "maxLength": 1
      }
    }
- set the “allowOffsets” parameter to false, which removes the need of building a model on blocks of evenly distributed data
"normalBehaviorModel": {
      "allowOffsets": false
    }
Irregularly recorded data
When working with irregularly recorded data, such as event-based data (where the difference between two consecutive timestamps is incidental), a model will either not be build or will be of low quality, as in default mode TIM Detect expects regularly recorded data.
To cope with that, the following approaches are possible:
- aggregating the data by a unit of time, effectively 'regularizing' them,
- setting the “allowOffsets” parameter to false, which removes the need of building a model on blocks of evenly distributed data
allowOffsets: false
- converting the data or using other timestamps.
Domain specifics
Detection perspectives
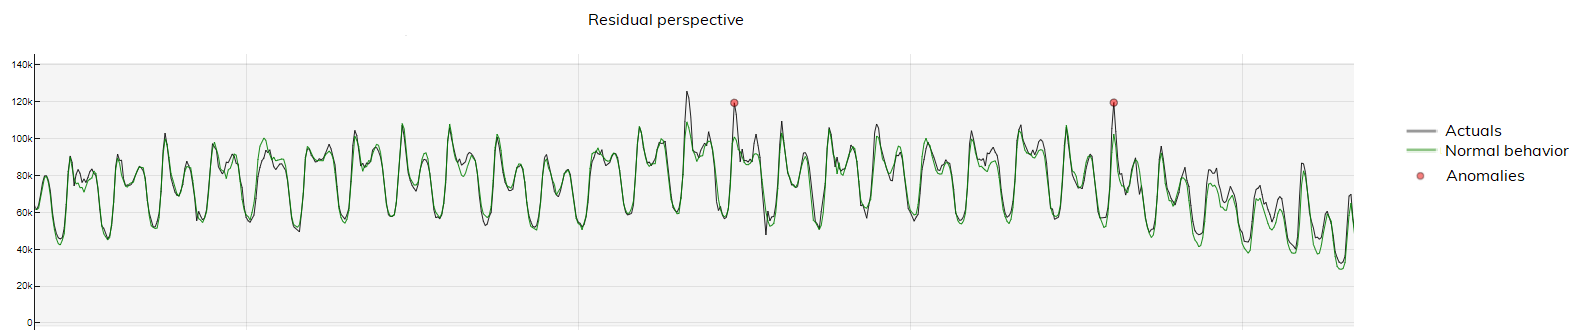
For the kpi-driven approach, the detection perspectives not only define how to look at anomalies, but they also provide a way for the user to adapt the anomaly detection process to their preferences. These perspectives determine what kind of behavior the model should see as anomalous.
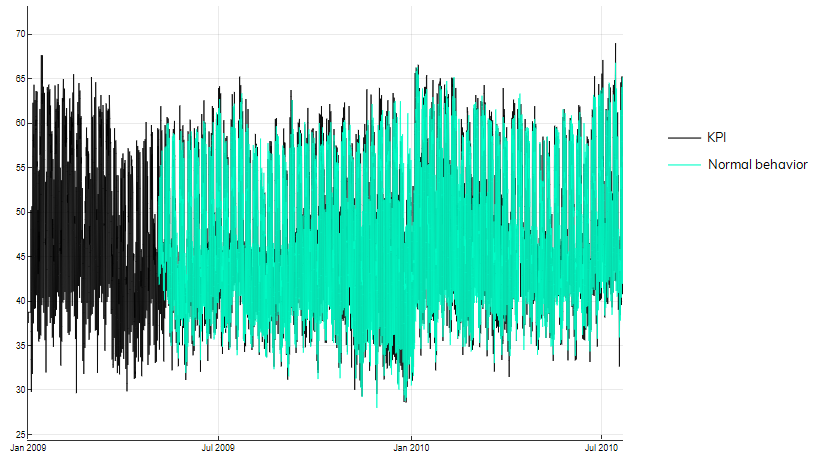
For example, the residual perspective below alerts the user only when there is a high deviation between actual and normal behavior:
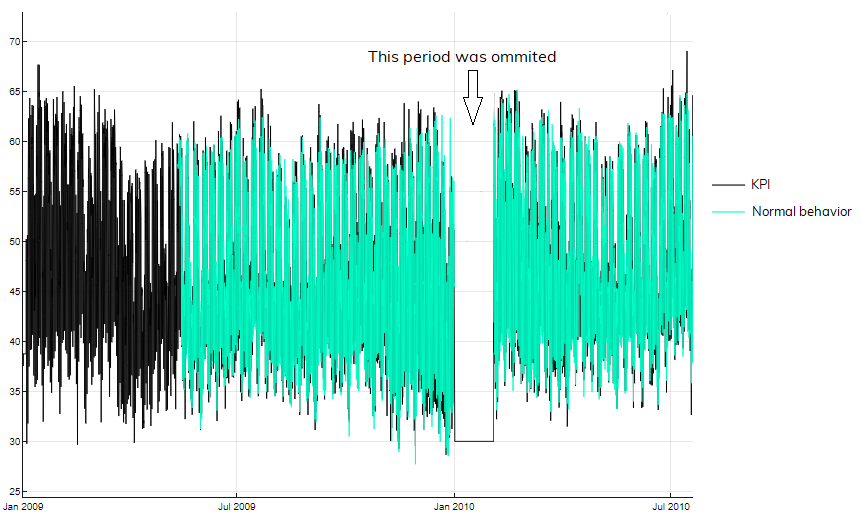
The imbalance perspective on the other hand, warns the user in case there is a deviation between actual and normal behavior that lasts for a longer period of time:
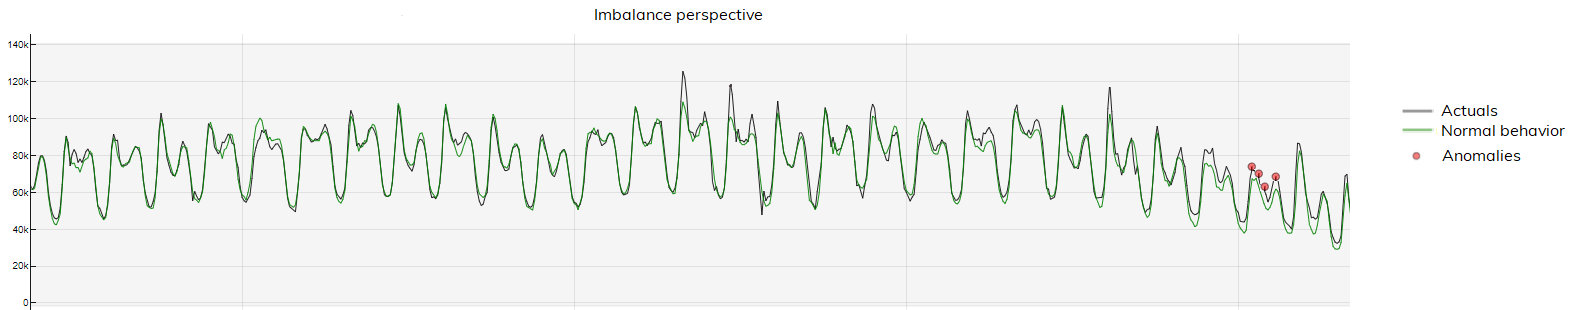
It is up to the user to select one or more perspectives to their preference.
Sensitivity
This parameter is used when building a model. TIM can find a reasonable sensitivity automatically, but the setting is also customizable so the user can finetune it to potential anomalies based on their business risk profile. It defines the decision boundary, separating anomalies from standard points. Each perspective in the kpi-driven approach has an individual sensitivity setting, while there is a single sensitivity value to configure in the system-driven approach. This section provides tips on how to adjust the sensitivity in concrete situations.
Unsupervised
When the training data has no labeled instances, the implicit assumption is that normal instances are far more frequent than anomalies (a maximal percentage of anomalies of 5% is assumed). In these cases, it is recommended to let TIM Detect find the optimal sensitivity automatically and analyze the anomalies this approach brings. The sensitivity value that has been determined by TIM is one of the returned results, and can then be used as a starting point for futher finetuning of this parameter, if so desired.
(Semi-)supervised
In the case of semi-supervised - when the training data has labeled instances only for the normal class (no anomalies are present in the data) - or supervised - when the training data data has labeled instances for the normal as well as for the anomalous class - AD, the following recommendations hold:
- if the number and disposition of normal class instances (no anomaly) allow to build reasonable model, then adjust the sensitivity to zero and build the model using normal class data only. This ensures that the model is not affected by any anomaly and the sensitivity will be chosen optimally,
- if the above requirement does not hold, build the model using all data and set the sensitivity as a percentual representation of the anomalies that are present in all the data included in the model building process.
Anomaly indicator window
For the system-driven approach, the anomaly indicator window serves to smooth the original anomaly indicator by averaging over the window of its last successive values. This is useful when an anomaly is considered as a longer period of higher anomaly scores.
By default, no averaging is applied (the window is set to 1 sample representing the initial anomaly indicator). It is however possible to adjust this setting to arrive at optimal results for the problem at hand.