KPI-driven detection
This part of the documentation dives into TIM's capabilities for anomaly detection with a kpi-driven approach. The following sections can be explored to build up a comprehensive understanding of these capabilities:
- Configuration: all the parameters that are available to be adjusted to the user's specific needs.
- Outputs: understand TIM's outputs.
- Solution templates: see TIM in action by following the manuals on how to apply TIM to specific use cases from different industries.
Engine schema
TIM Detect's kpi-driven anomaly detection is built on top of TIM Forecast's proven technology for automatic model generation for time-series forecasting. By selecting the relevant domain specifics and creating the most appropriate model(s), TIM automates the anomaly detection process.
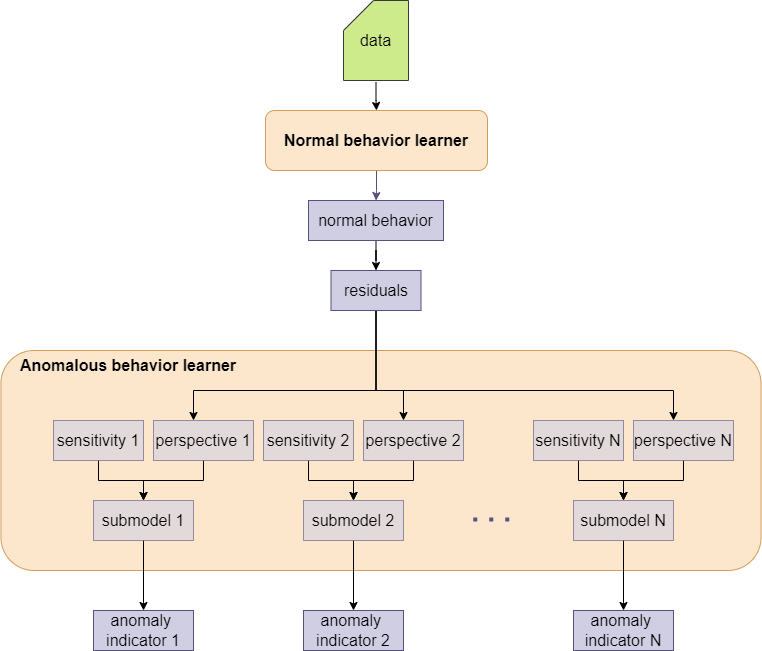
The model building process can be characterized as follows. First, data is gathered. This data is typically unlabelled and contains mostly normal observations, thus anomalies are rare. Then, the notion of normality is extracted in the normal behavior model. To do that, the forecasting capability of TIM is used. The normal behavior is used to calculate residuals - difference between normal behavior and KPI. These residuals are then used in the anomalous behavior model to create detection perspectives. Each detection perspective has a corresponding sensitivity parameter which can be found automatically or configured manually. The perspective - sensitivity pairs are used for building submodels - each producing an anomaly indicator as a result. The resulting anomaly indicators contain values indicating to what extent a particular data point goes beyond what could be considered as ‘normal’.