Navigating TIM Studio
Assets created in TIM platform are organized in a hierarchy that helps user navigating throughout the platform. This section explains various elements of this hierarchy and their associated relationships.
Teams
![]()
Users are organized into teams within the organization. For instance, there may be a team dedicated to Sales Forecasting and another team focused on Predictive Maintenance. To manage these teams, users can click on the Teams icon in the navigation sidebar, as illustrated in the figure below. From there, users can add, remove, or edit teams.
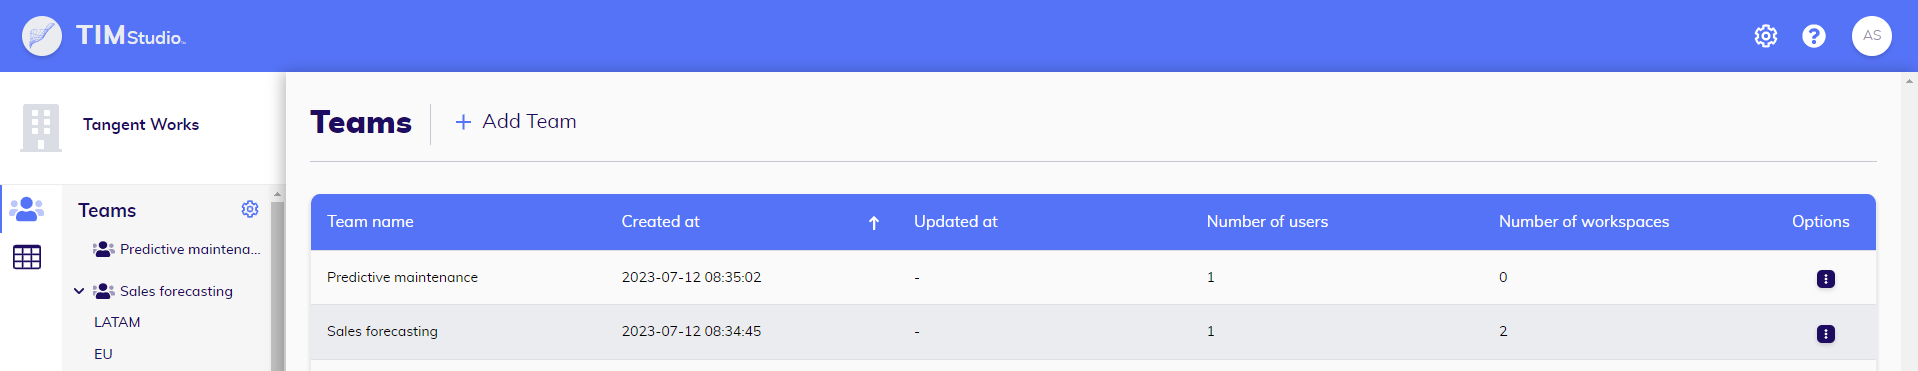
When a team is selected in the sidebar menu, users are taken to a single team management page where they can add or remove users, grant ownership, add or edit workspaces, and make edits or delete the team.
Workspaces
![]()
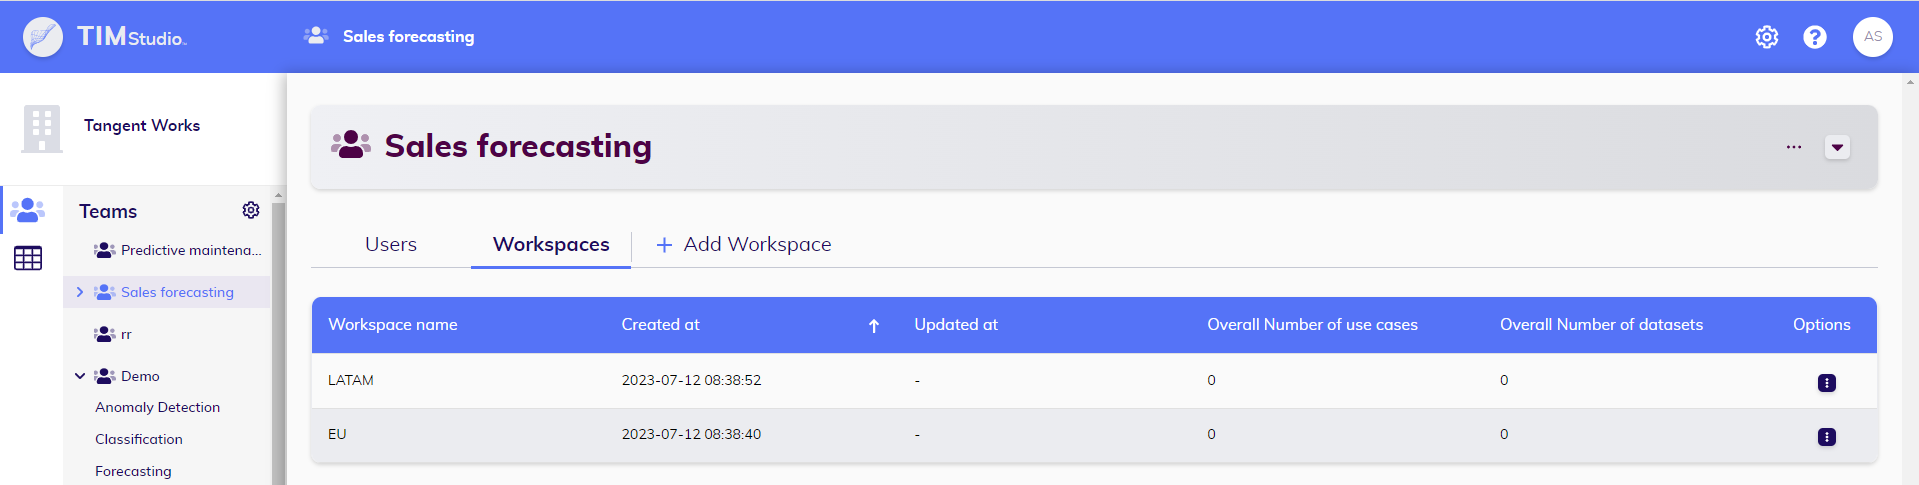
The work of each team can be organized into different workspaces. For example, the Sales Forecasting team may have separate workspaces for Latin America Sales and European Sales. Workspaces are utilized to organize datasets and their corresponding use cases. When a workspace is selected, it displays two tabs: one for datasets and another for use cases specific to that workspace. Additionally, selecting a workspace updates the horizontal breadcrumb navigation bar to reflect the current selection.
Datasets
![]()
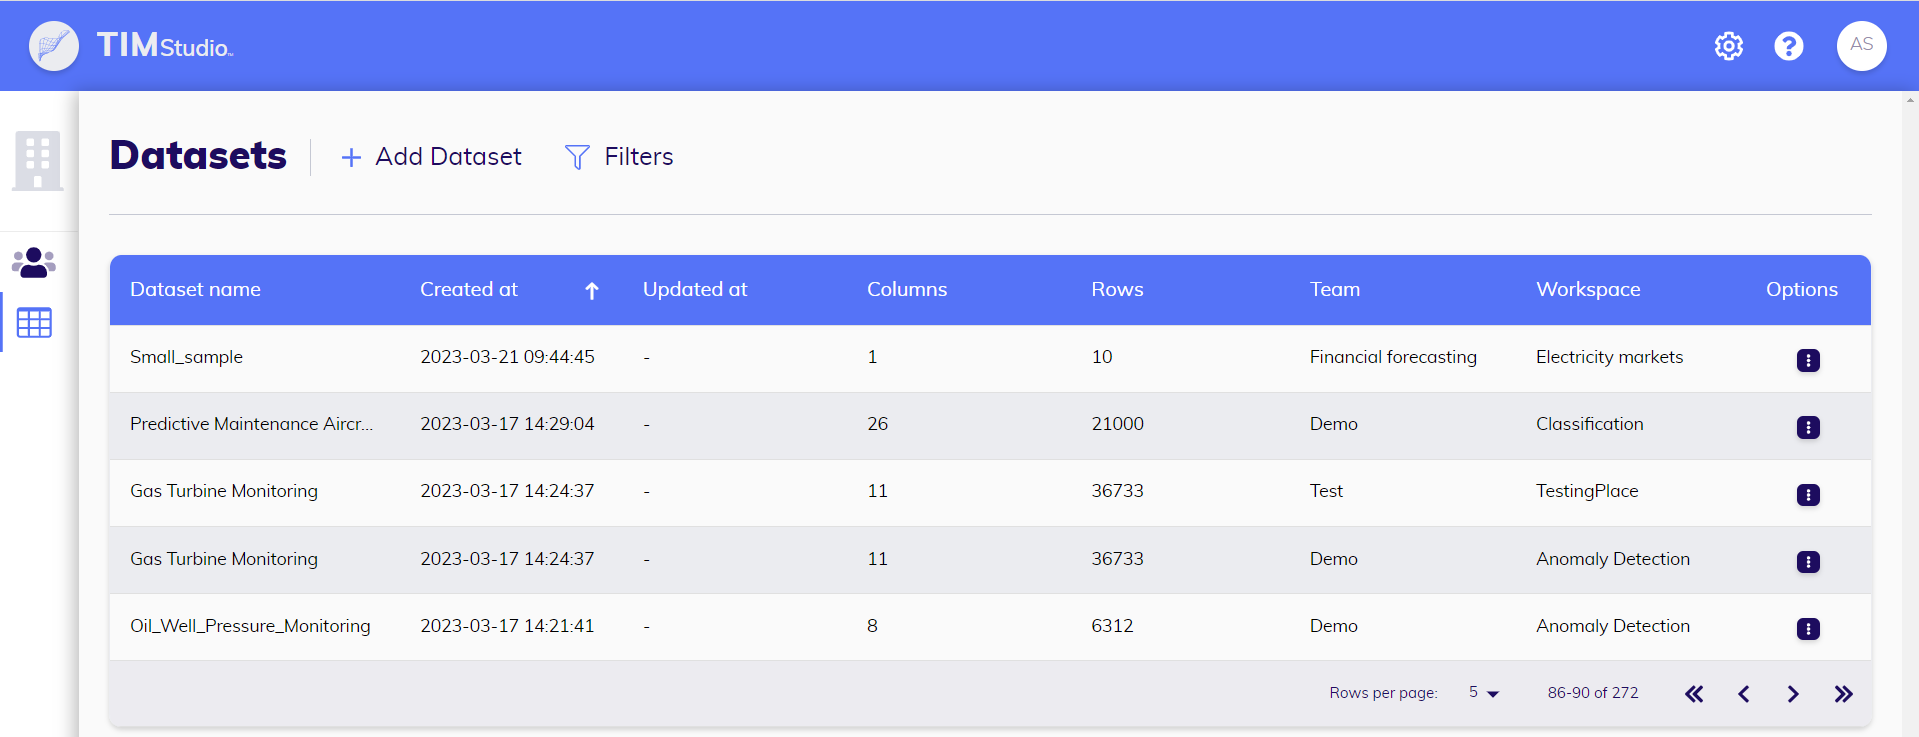
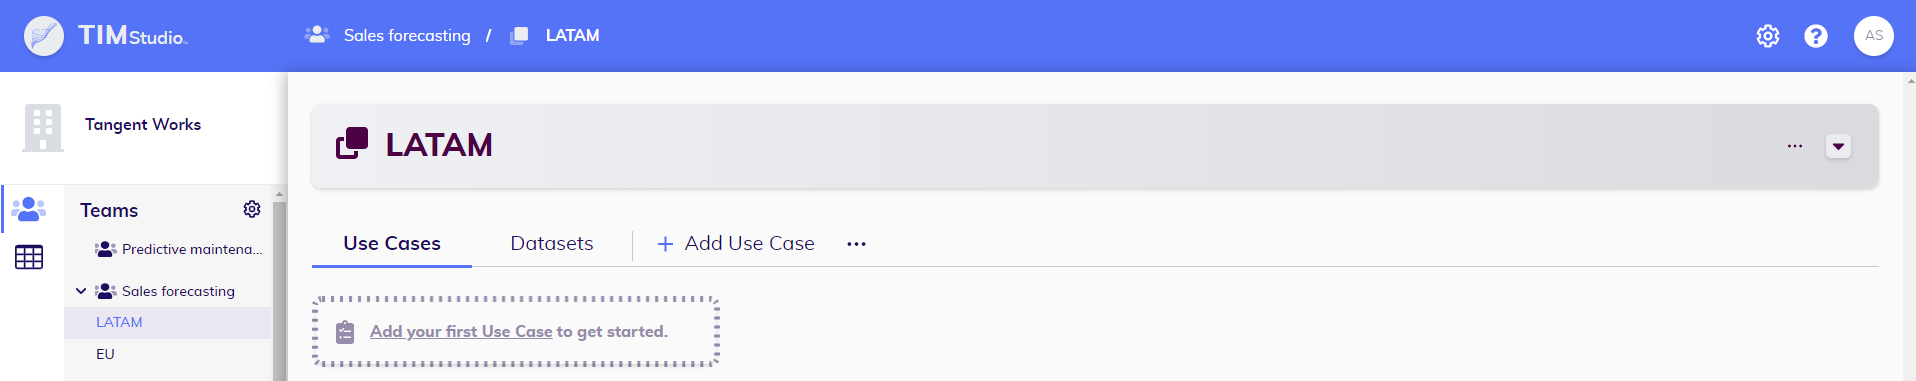
At the beginning, the workspace is empty, and the user should start by uploading dataset(s) into this workspace. After uploading, users will be able to leverage TIM’s time-series database, TIM DB. TIM Studio will provide users with an overview of metadata and statistics that may be relevant in the data exploration and preparation phase.
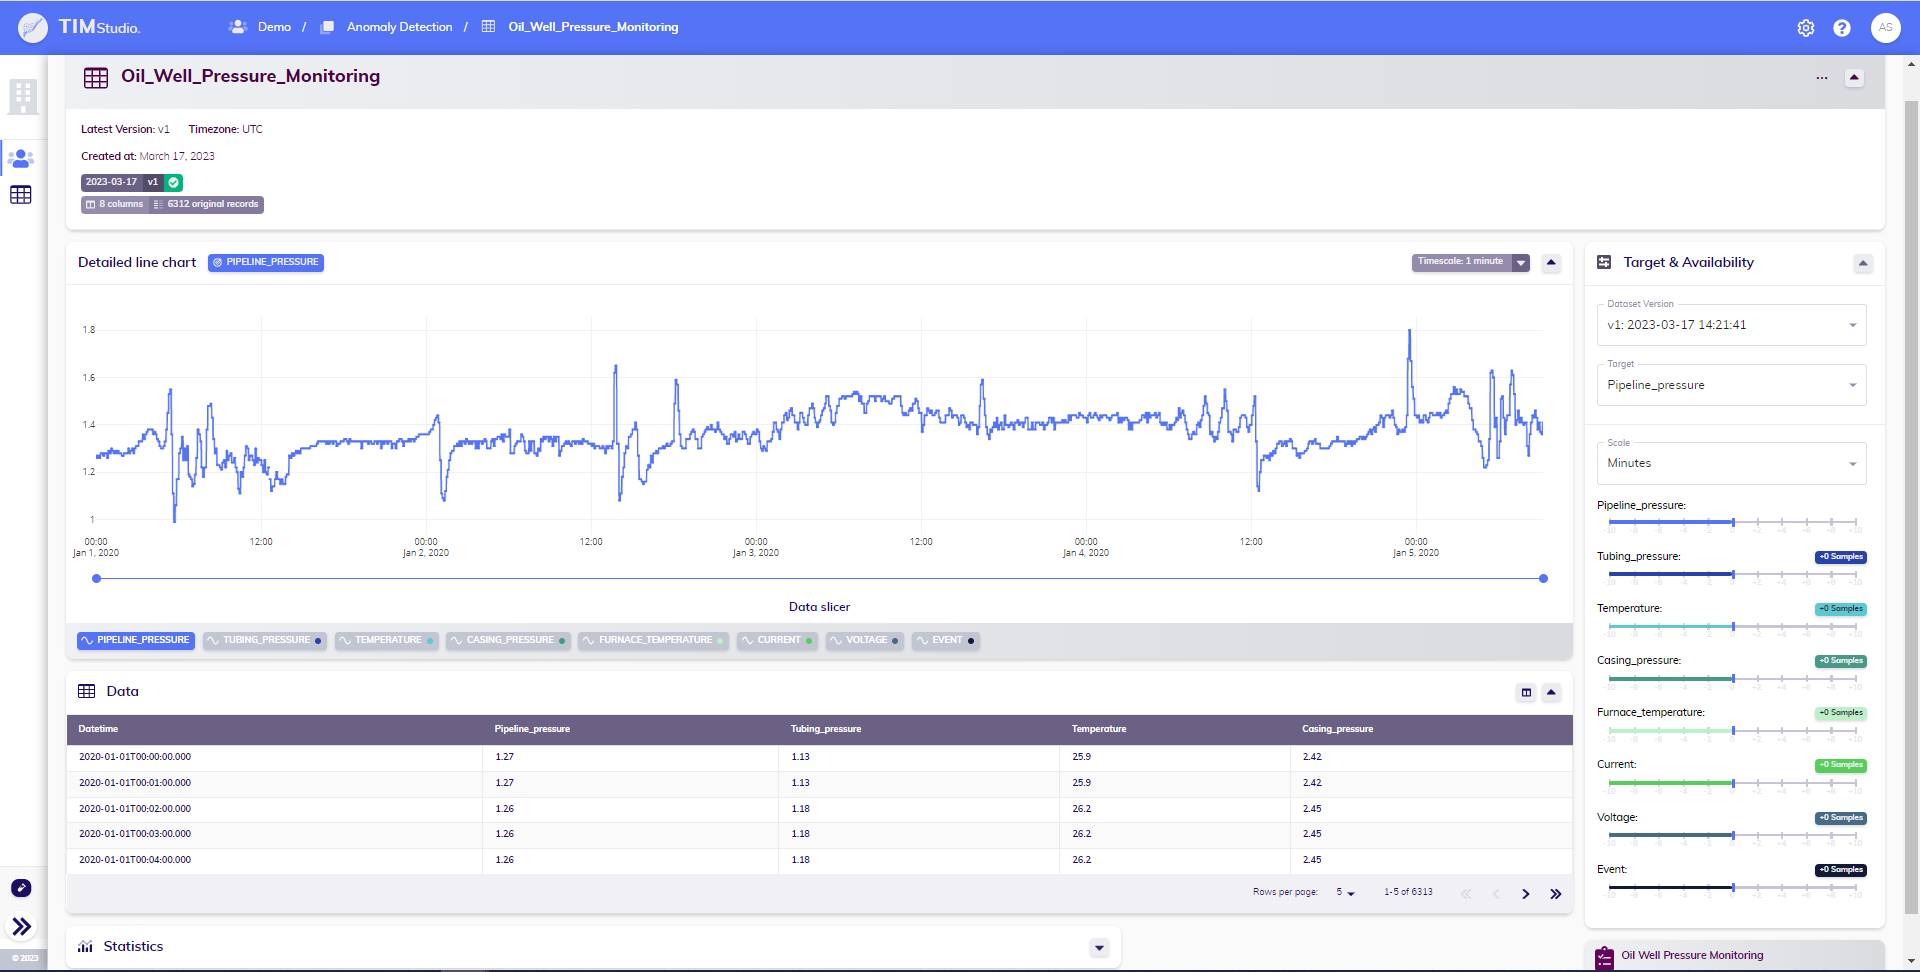
TIM DB includes a lightweight data version control system, allowing you to keep track of your version history and update your datasets as new data becomes available.
Use Cases
![]()
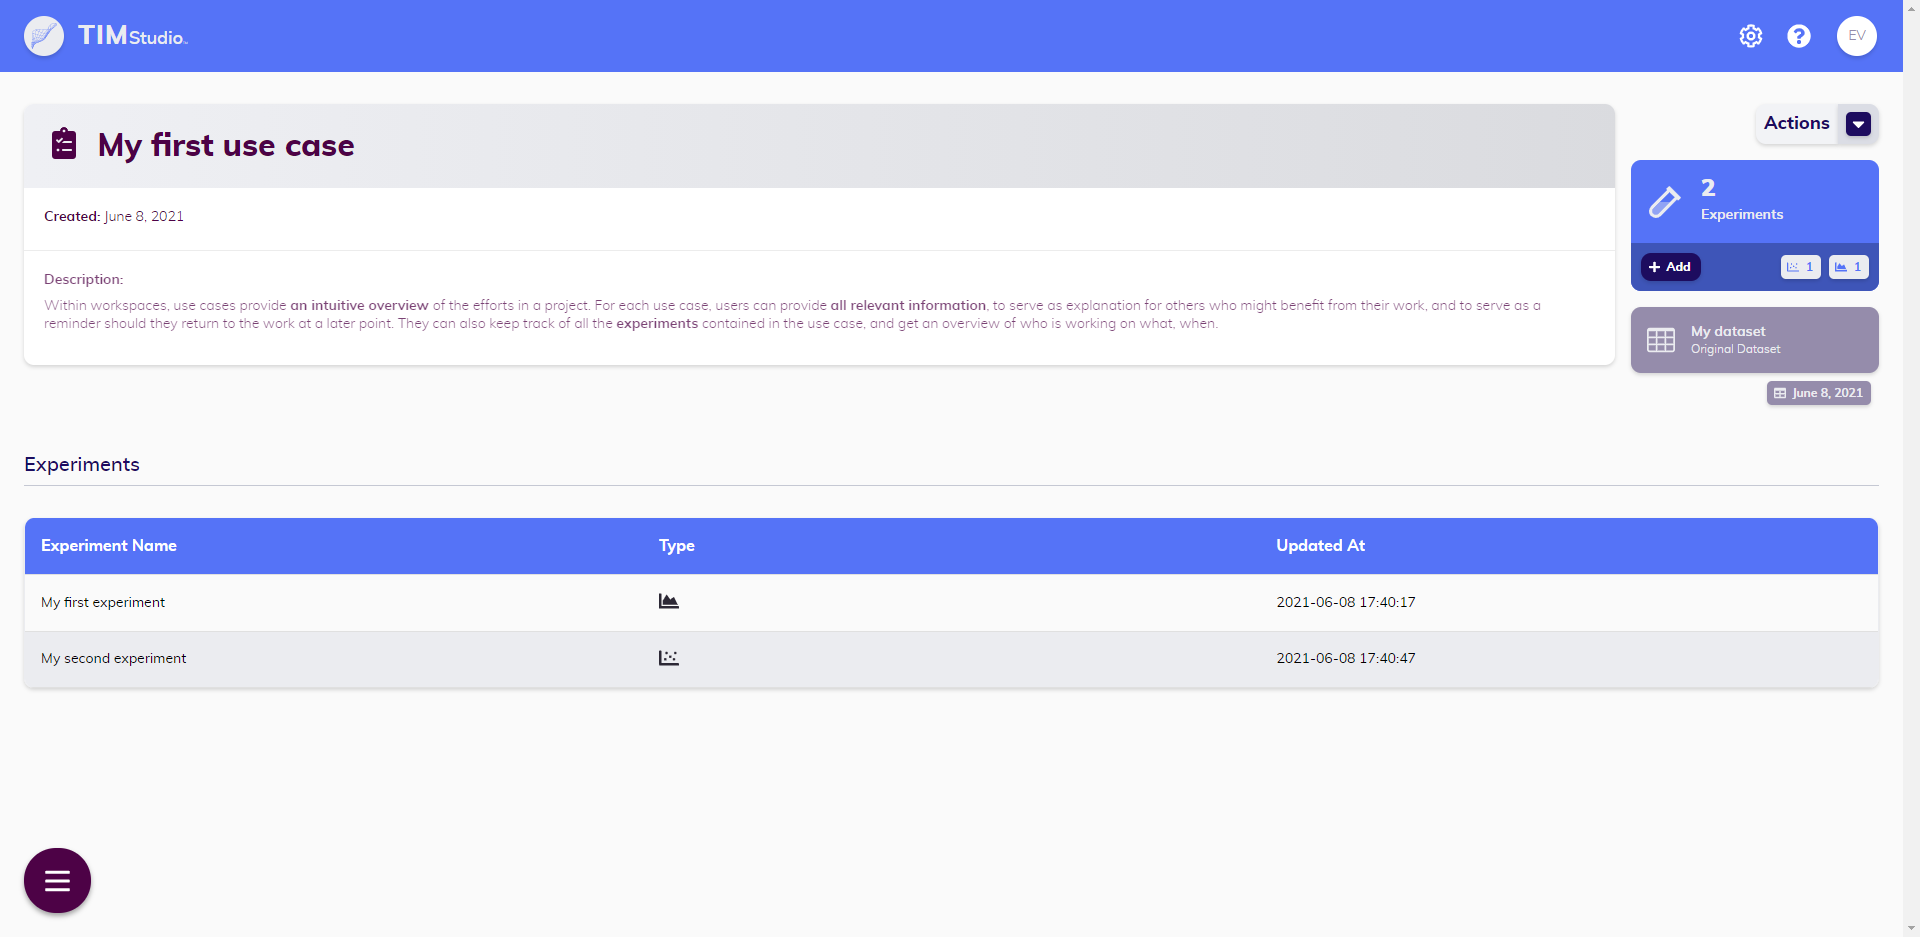
Uses case is linked to a single dataset and aims to provide an overview of the efforts in a project.
For each use case, users can provide all relevant information, to serve as explanation for others who might benefit from their work, and to serve as a reminder should they return to the work at a later point. They can also keep track of all the experiments contained in the use case, and get an overview of who is working on what, when.
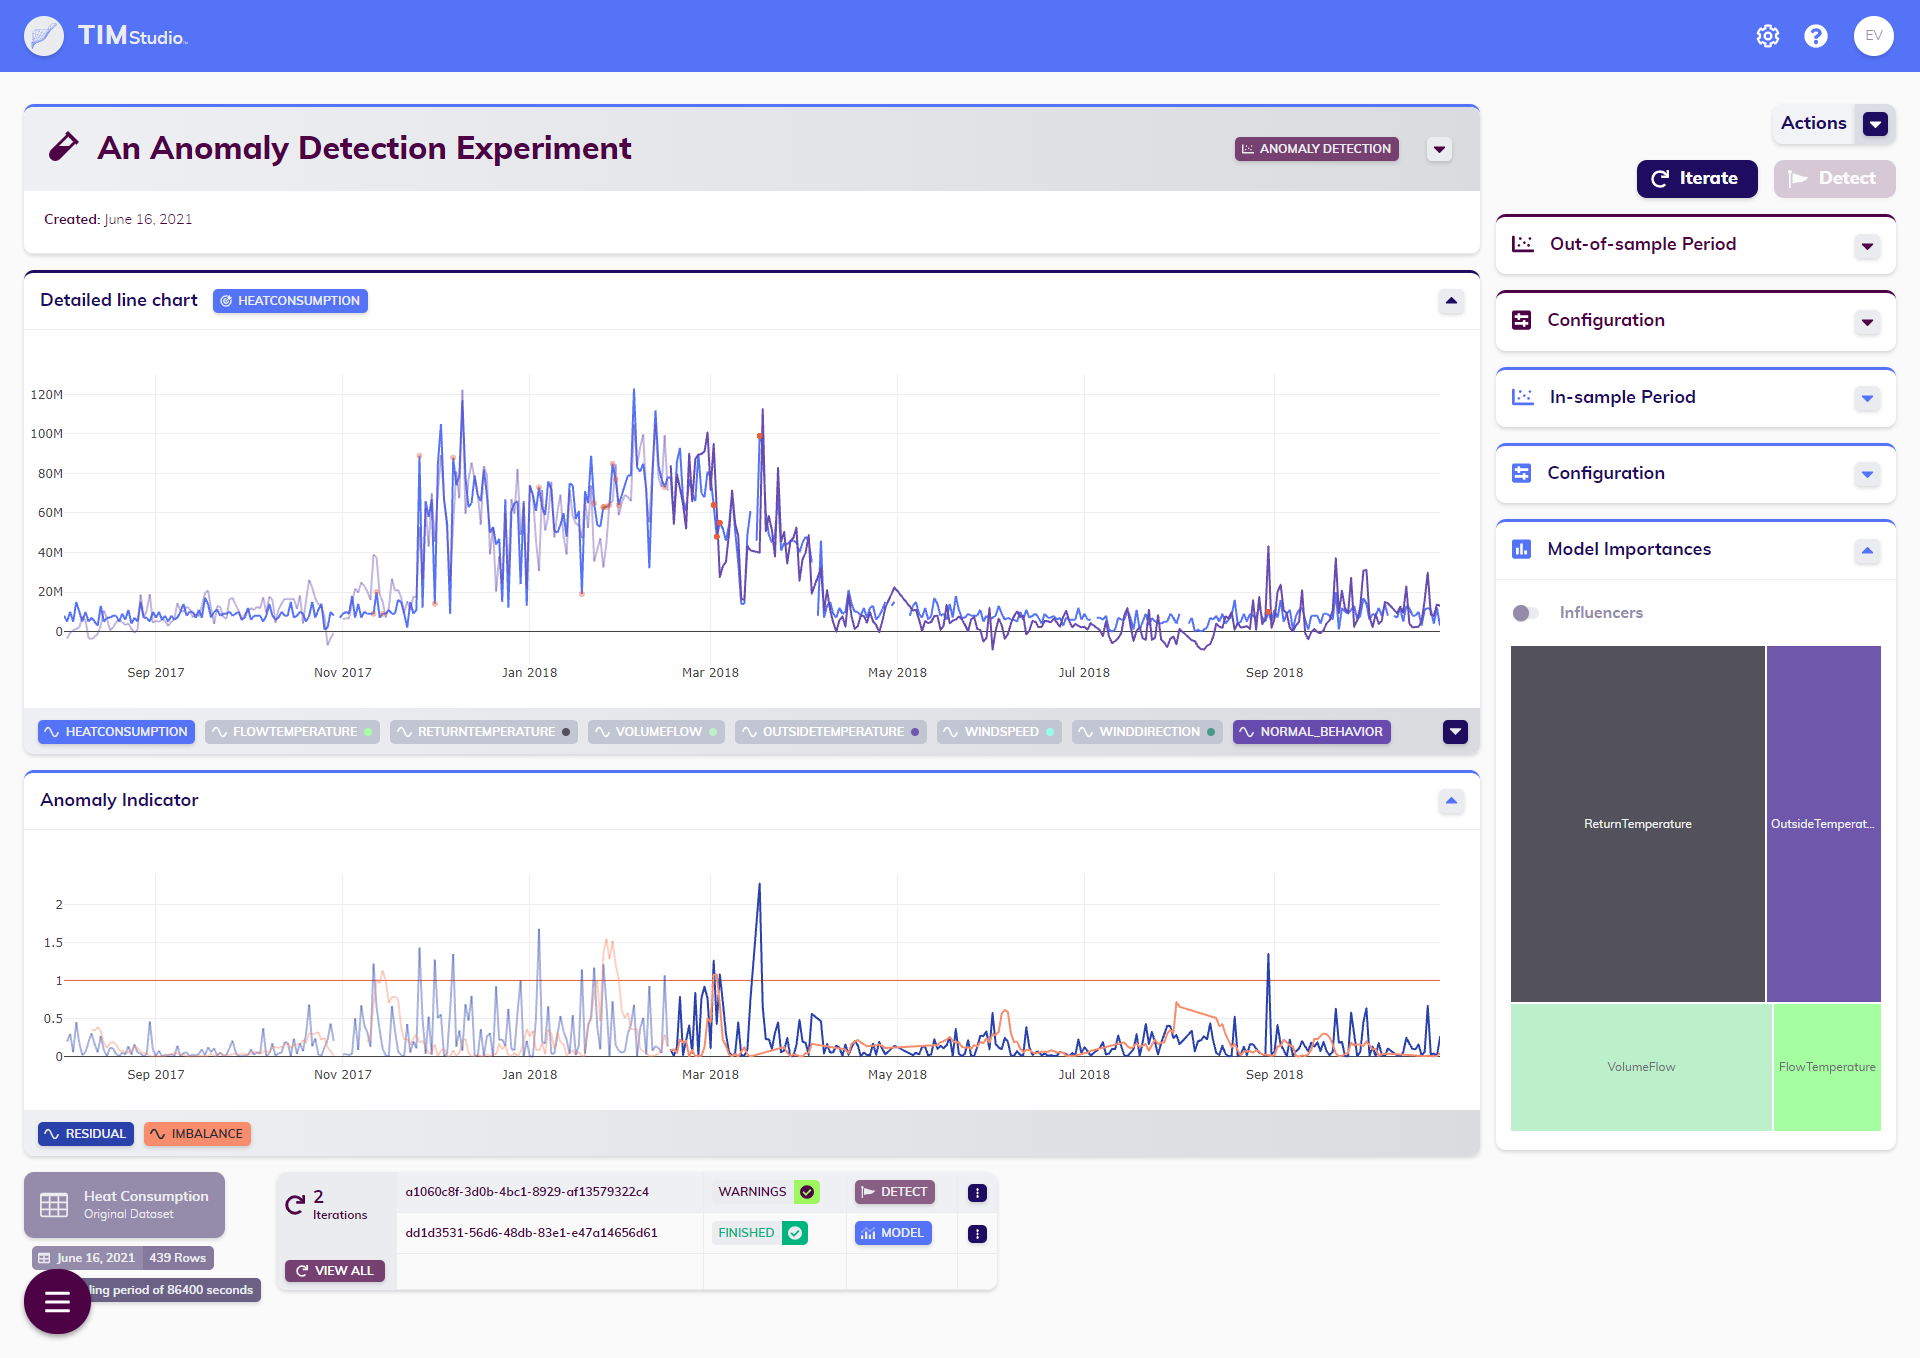
Experiments
![]()
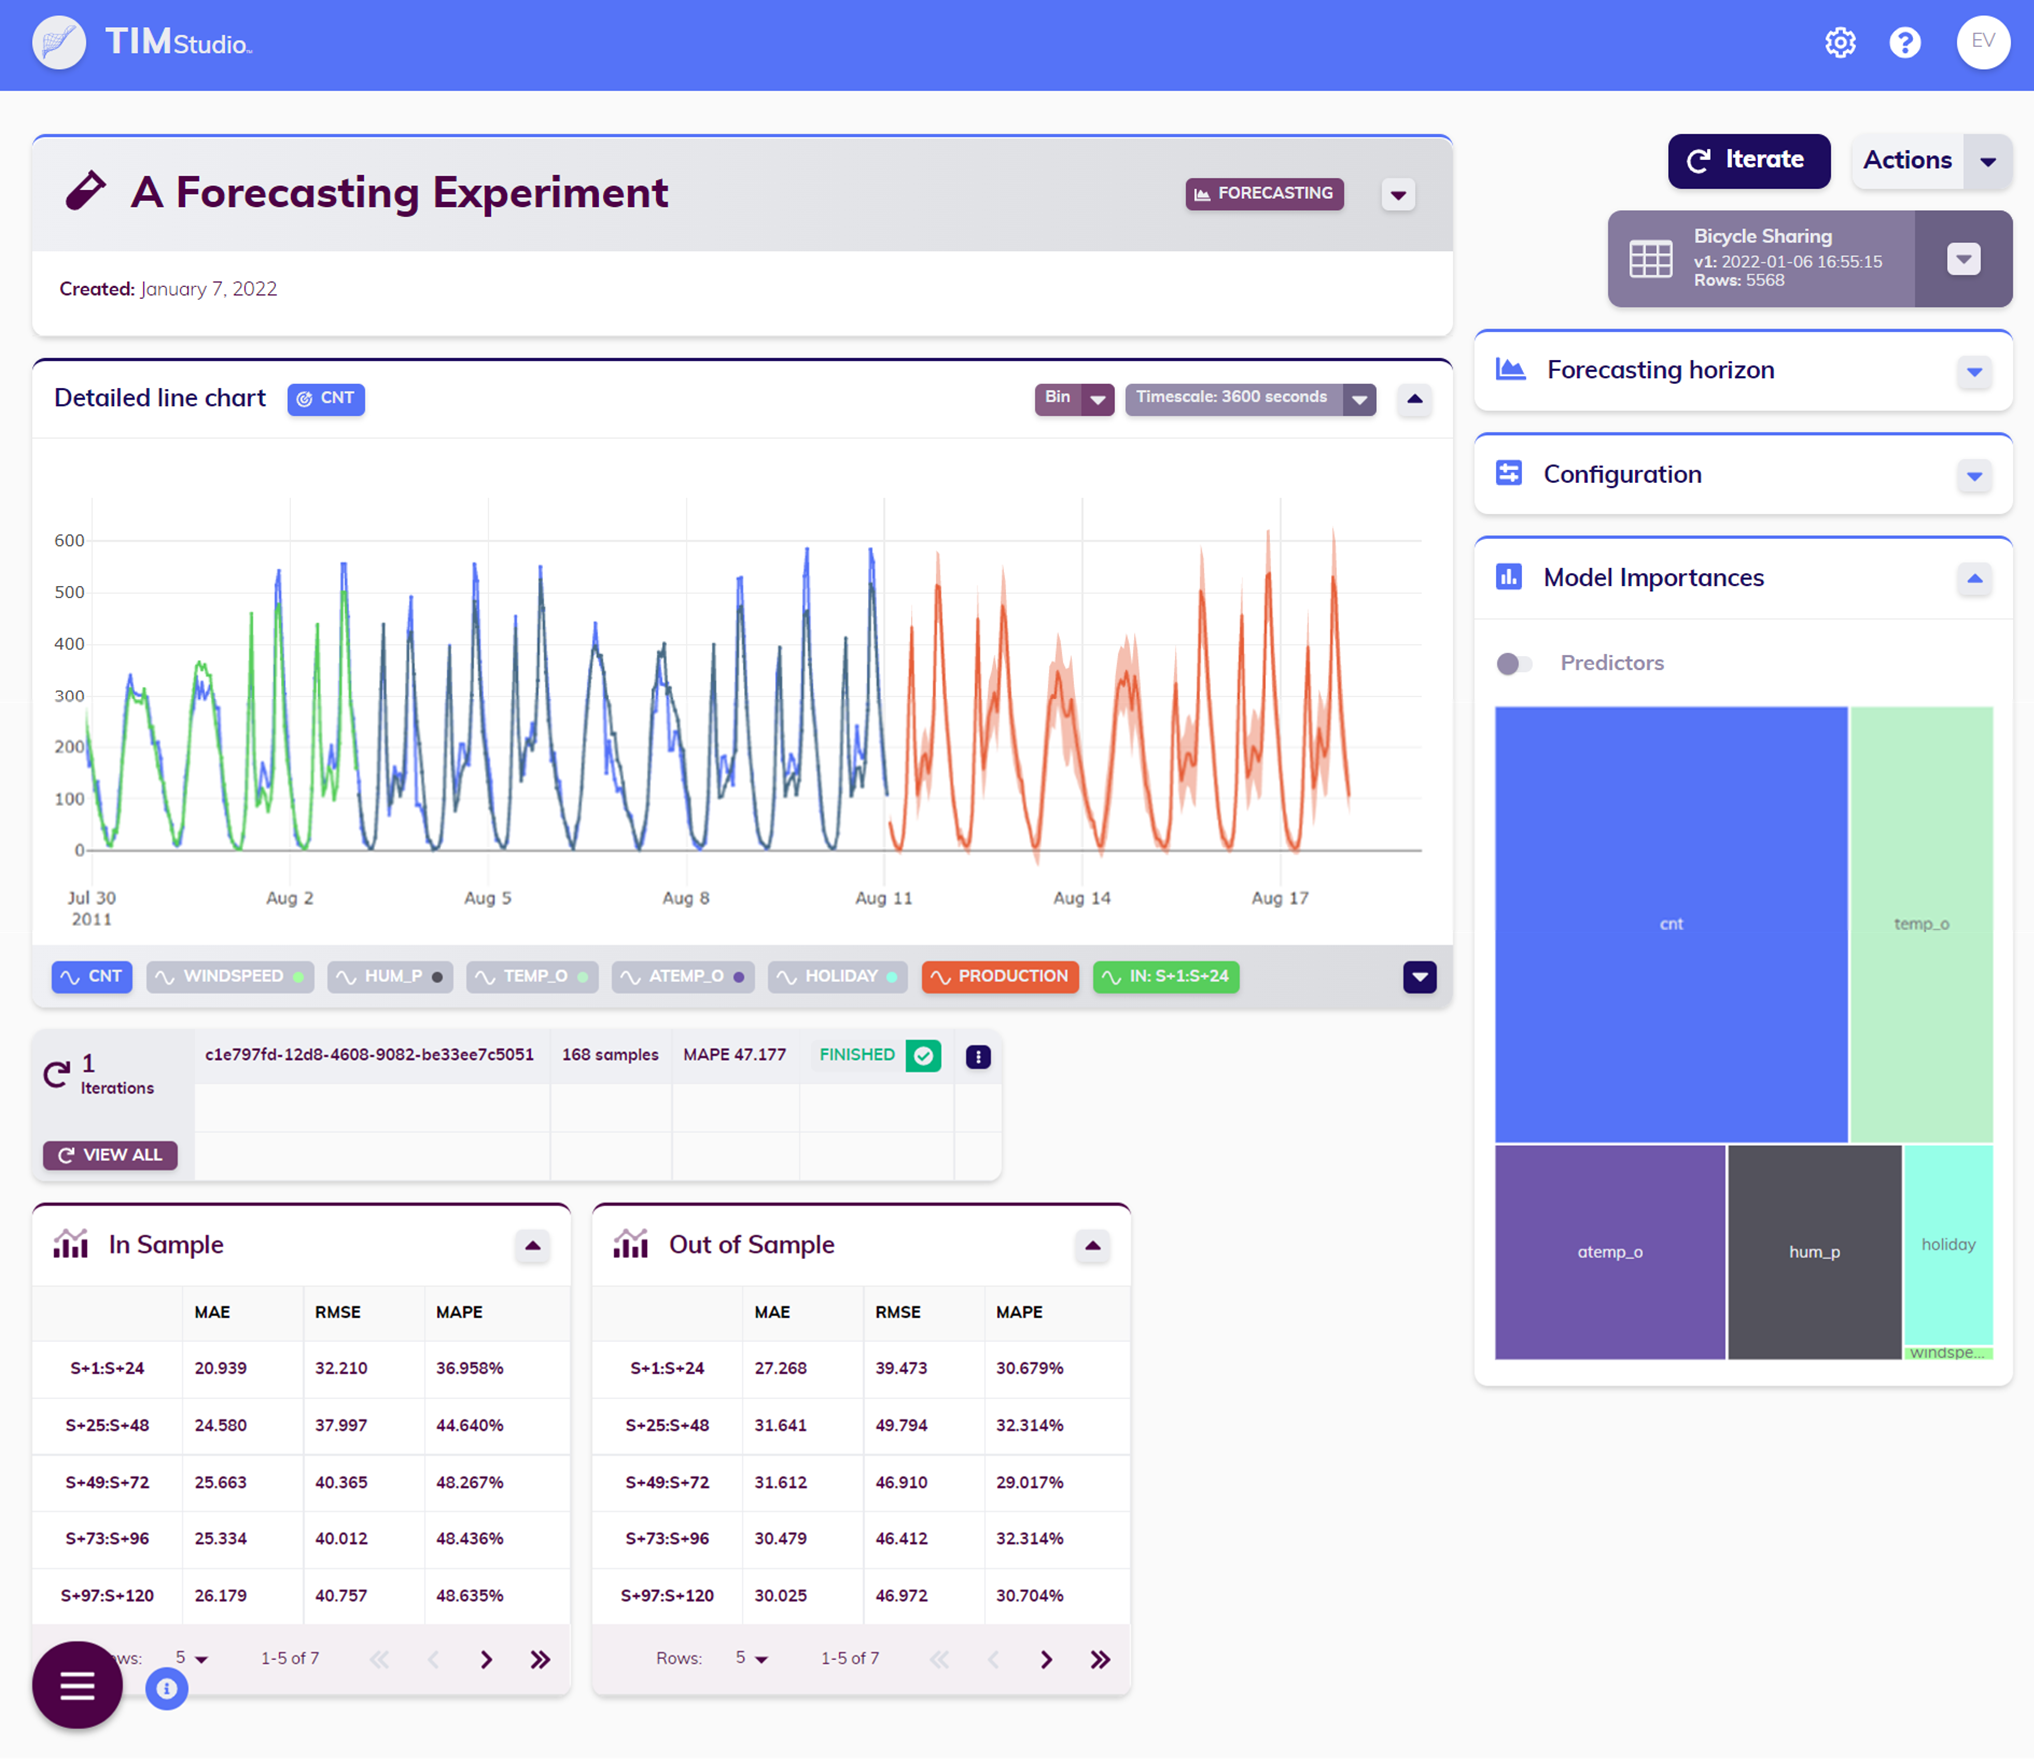
Within a use case, multiple experiments are contained. An experiment is the working point in the TIM platform, where users will find the core of the analytics. Each experiment is focused on a single type of analytics: either forecasting or anomaly detection.
Within an experiment, users get to explore the data, again, and can browse through configuration options. Once the desired settings are selected, an ML request can be triggered and TIM Studio will show how the calculation progresses.

After the model has been built and applied, it’s time to examine the results. Users can get insights into the models that were used, measure the performance and adjust were needed by iterating over the job.
Profile
A user can view and manage their own profile. This profile is accessible via the user icon at the right side of the top blue bar.
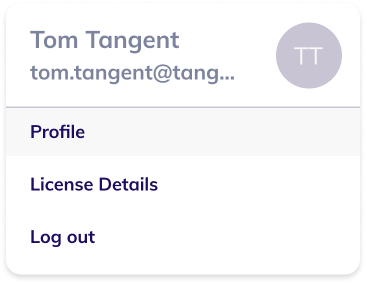
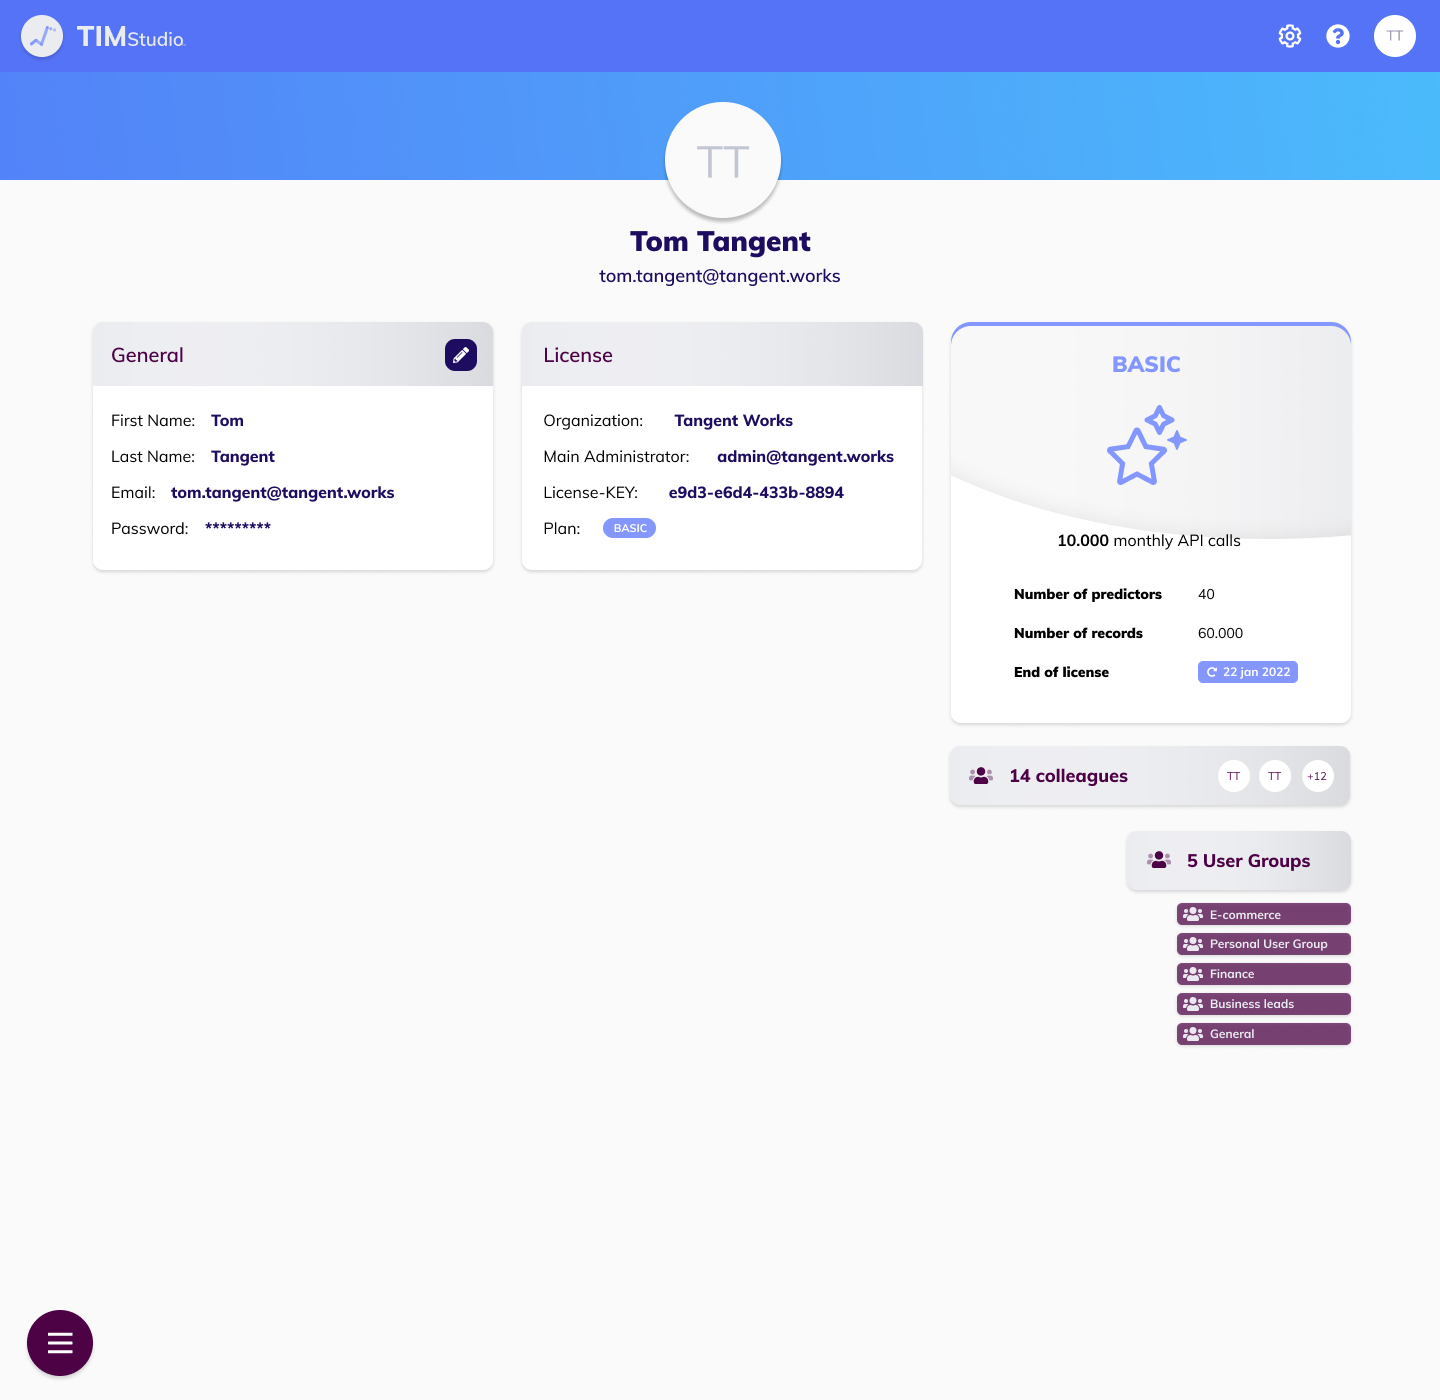
By selecting "Profile", a user navigates to their profile page, where they can see an overview of their personal data, the license they are part of, their colleagues and the user groups they are a member of. Administrator users can manage their license on this page too.
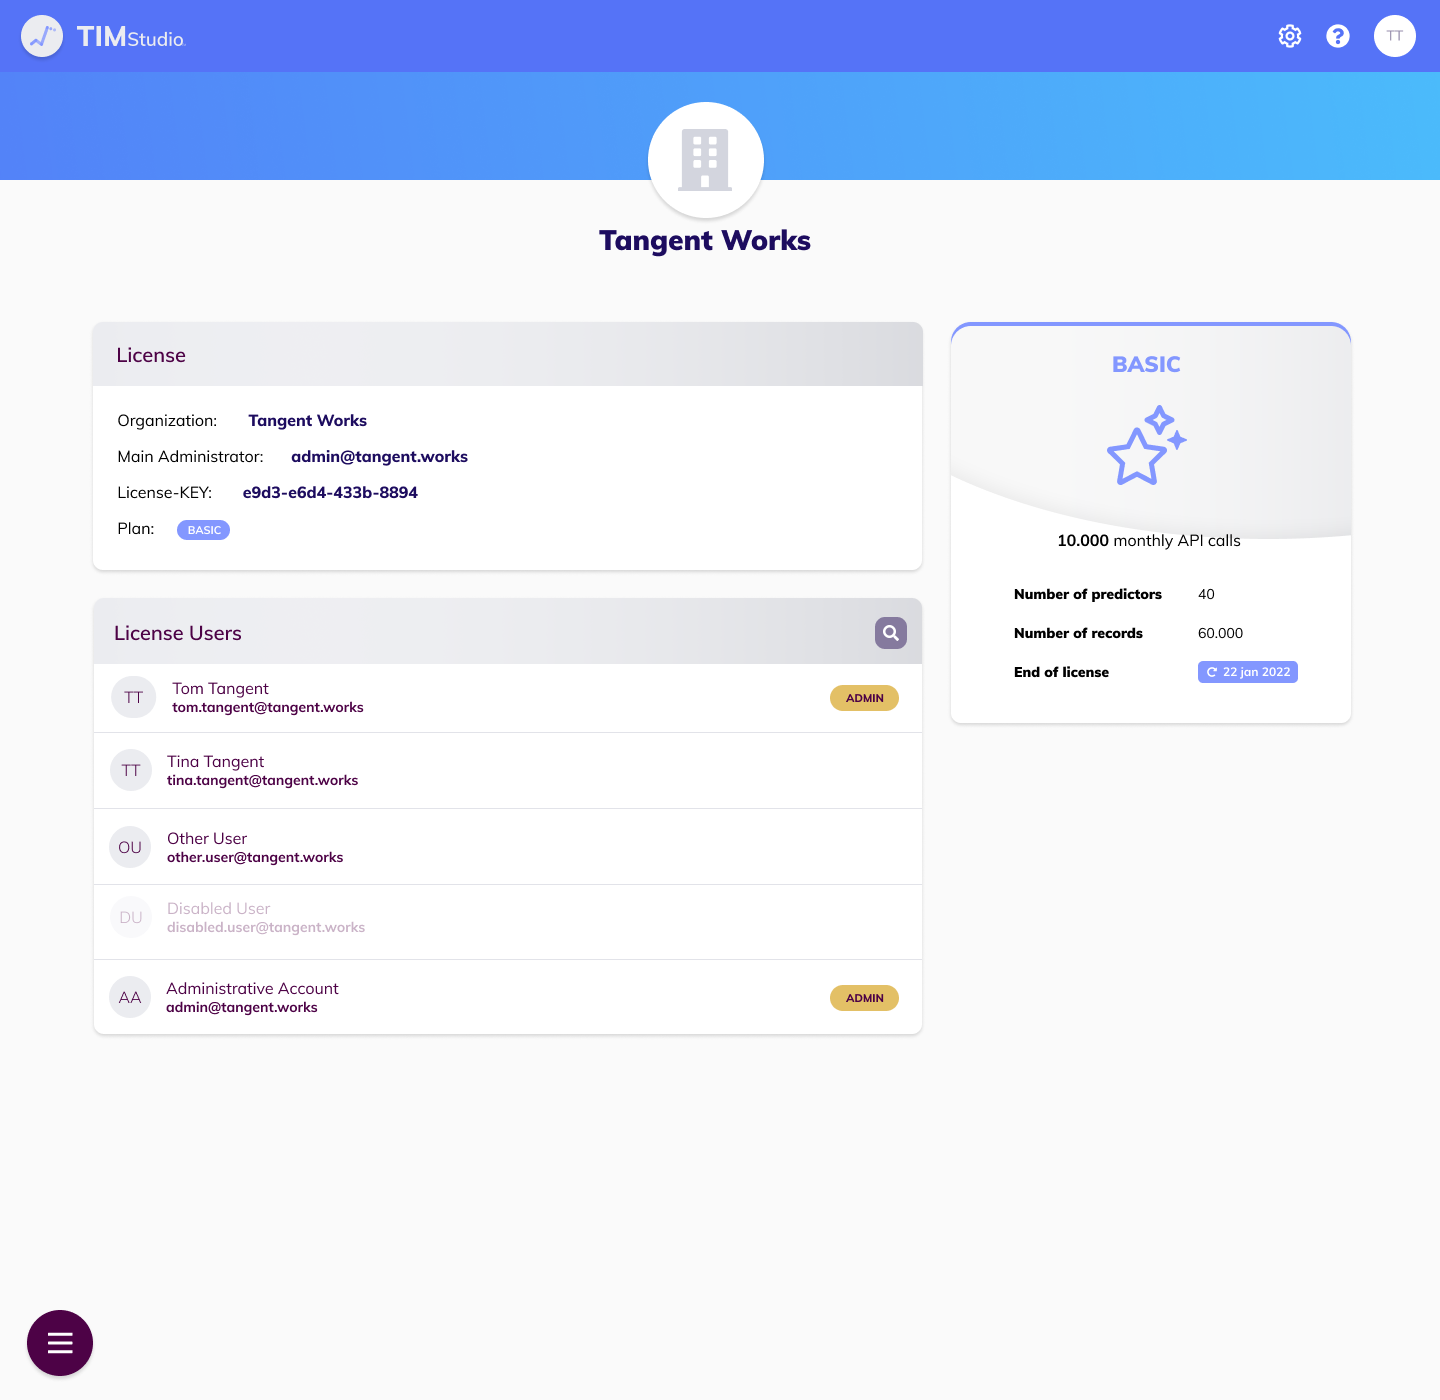
License
A user can also view and manage (for administrator users) the license they are part of in more detail. The license details page is accessible via the user icon at the right side of the top bar.
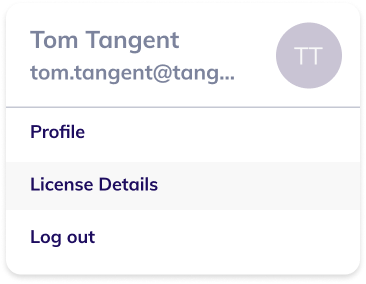
By selecting "License Details", a user navigates to the license detail page, where they can see an overview of the license they are part of and the users of that license. Administrator users manage their license on this page too.