Quick Start
If you'd like to take a guided journey and learn how to work with TIM Studio quickly, follow through this article.
We think that Bike sharing dataset (shared at Kaggle) is great example for learning. We will build Use Case for predicting rentals of bicycles in major US city. On this journey, you will learn how to work with Datasets, explore data, run first experiment (and create Use Case), fine-tune settings iteration by iteration, switch to production and other.
Assuming you already have TIM license and login credentials, let's start with Datasets.
Uploading your data
Let's learn how to add data to TIM Studio:
download the data for bike sharing as CSV file, it contains values for bike rentals count, public holiday flag, and weather predictors for temperature (feel and real), windspeed, and humidity,
navigate to Datasets section in TIM Studio,
click on New Dataset,
pick CSV file from your hard drive,
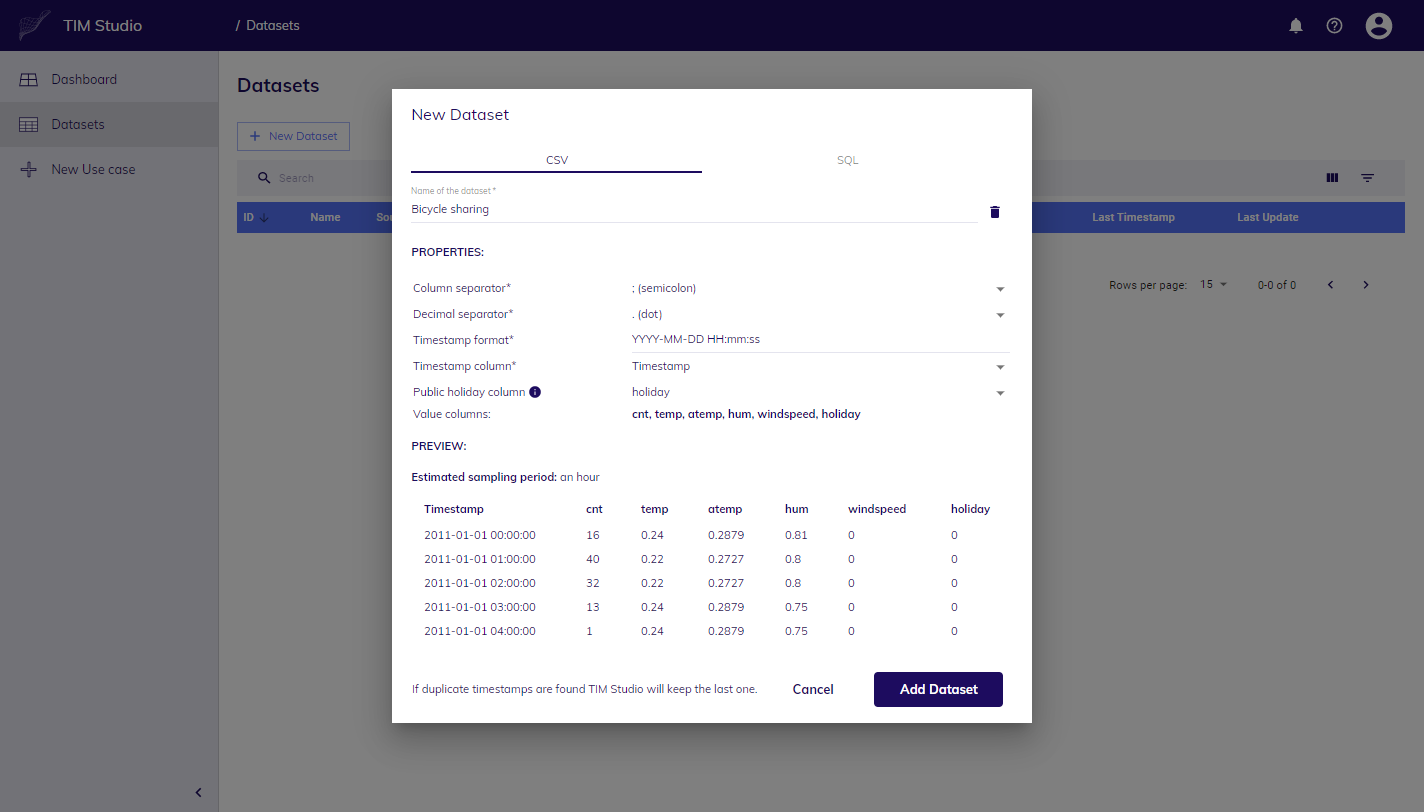
confirm timestamp format (YYYY-MM-DD HH:MM:SS), columns separator (;), decimal separator (.), timestamps column, when filled in correctly you will be given preview of first few rows,
pick holiday column as Public Holiday, this will unlock additional functionality (Dictionary) in TIM engine,
click on Add Dataset button,
you can monitor progress of upload in list of Datasets,
when finished, you can see TIM Studio detected sampling period, size, and other details automatically.
You just finished the first step on your journey in TIM Studio.
Exploring your data
Once you uploaded your Dataset, you are ready to take a closer look and explore details.
in the list of Datasets, click on its name,
detail page is open, you can see summary in upper part, how many rows and columns are there, what is timestamp of last data point etc.
below is the chart, select interval of your interest, you'll notice chart zoomed in to desired interval,
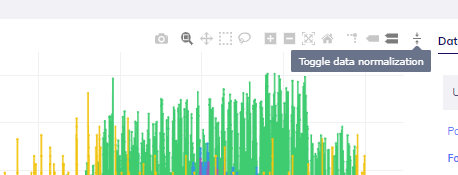
by default, data in chart are not normalized, to turn on normalization, click on the button in top right corner of chart (move your mouse over chart, group of small icons will appear, then pick the one at the very right),
to focus only on columns of your interest, it is possible to switch series rendered in chart on and off, just click on series name in legend below chart,
if you switch to Explore tab, you can see your data in tabular form, quickly check first and last rows by sorting timestamp column,
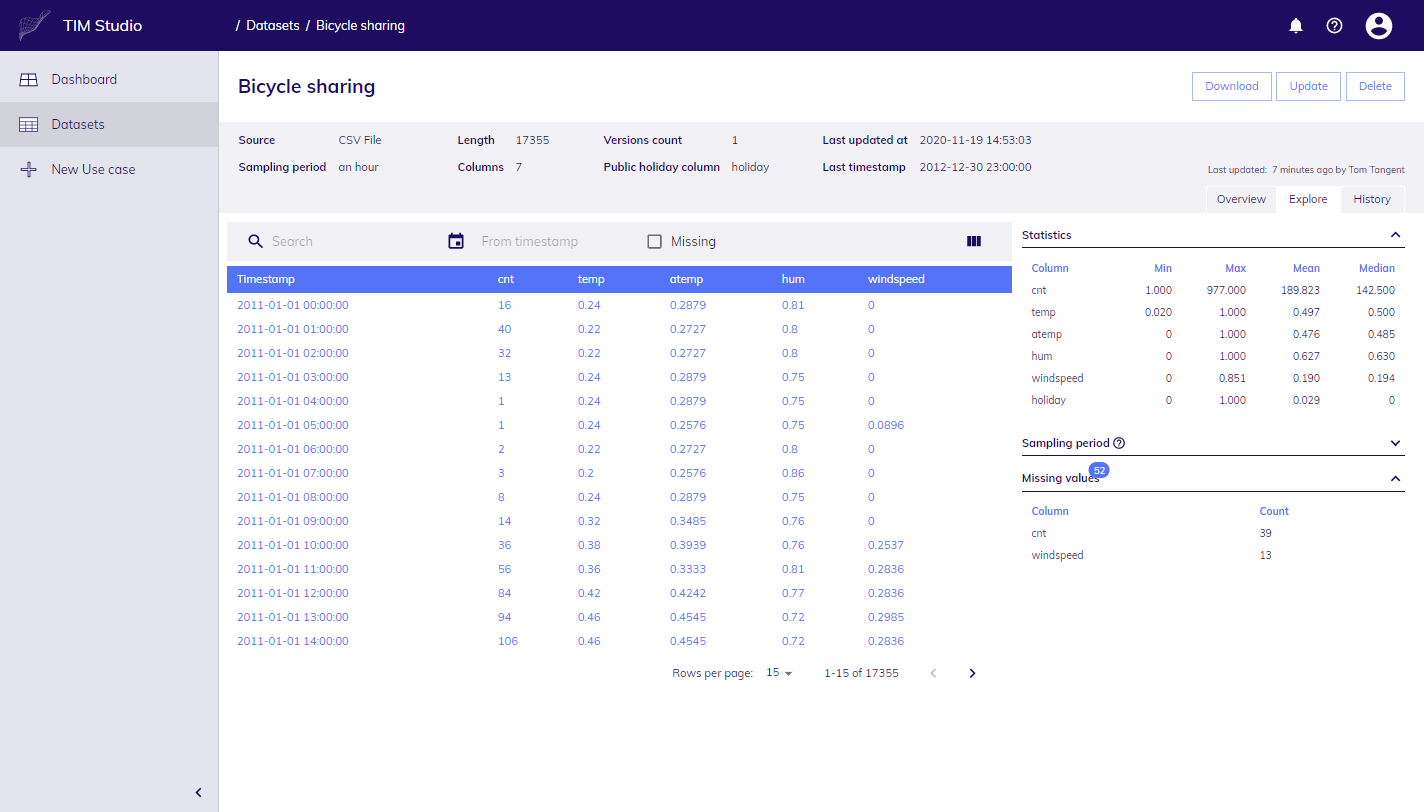
statistics such as min, max, mean etc. per each column are displayed at right hand side, as well as details about sampling period,
if you wonder whether there are any missing values, check section Missing values, if there is at least one, you will see it in the list with count per column; to display exact timestamps check checkbox in table (Missing) and focus on desired column,
you can see that cnt, and windspeed have both some missing values, the reason is simple, cnt represents bikes used, to get its actual historical values, it takes some time and this is how data would look like at 10 AM every day, weather and holiday values are available to the future as we get forecasted values, however it is difficult to obtain windspeed forecast in sufficient quality, thus it ends at 10:00 AM next day; the availability of data and time of our prediction basically defines our forecasting situation
You just explored your Dataset. It is time to build Use Case with this Dataset and experiment.
Your first Experiment, and Use Case
Experiment is vehicle to support your (business) case.
Our goal is to predict usage of bicycles per hour for current and next day as precisely as possible. The right amount of bikes in the system has direct impact on availability of the whole service hence satisfaction of people who'd like to rent a bike.
To confirm if we can support it with this Dataset, and TIM's functionality, lets experiment little bit:
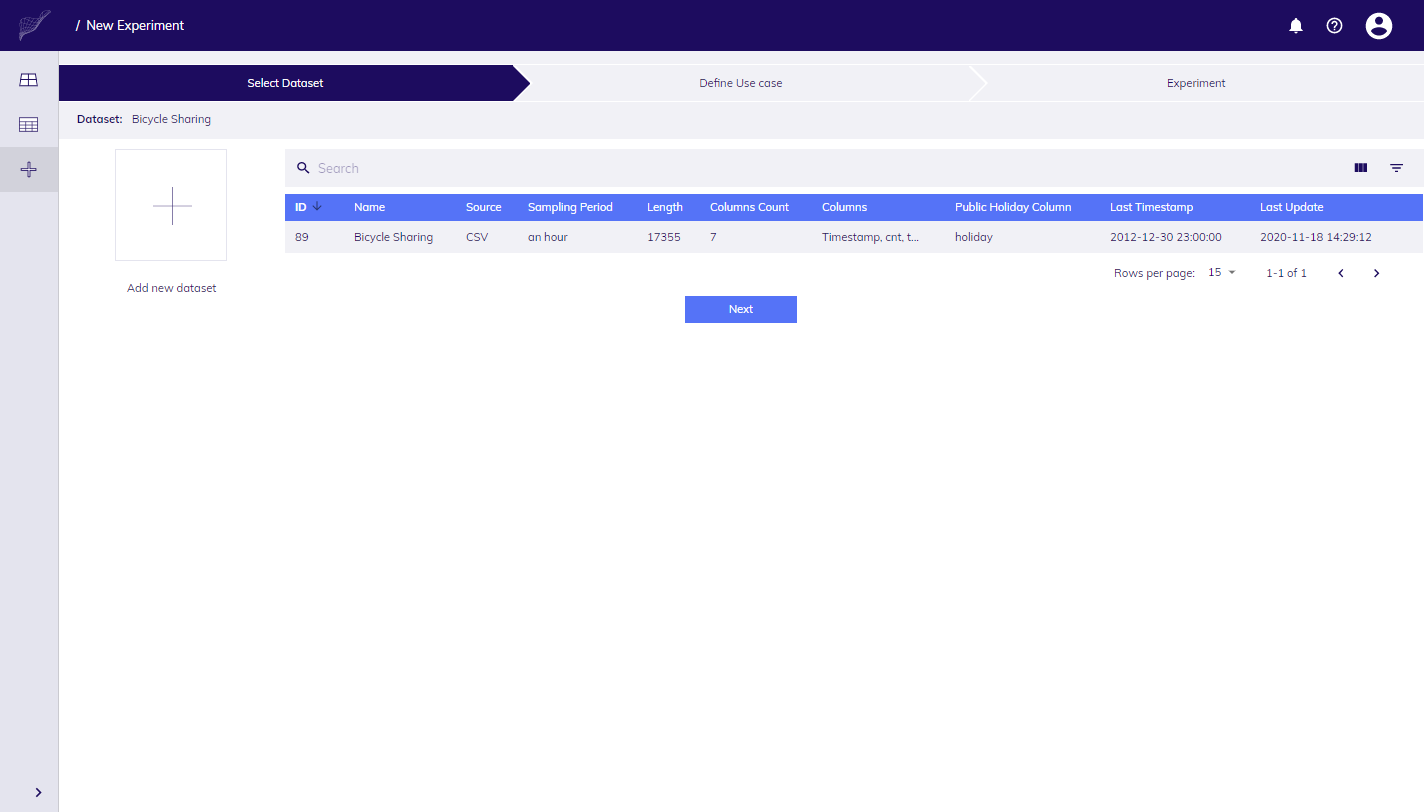
click on the big "plus" tile in dashboard (home page),
you are taken to (step by step) Wizard, at first, select your Dataset in the list and click on Next,
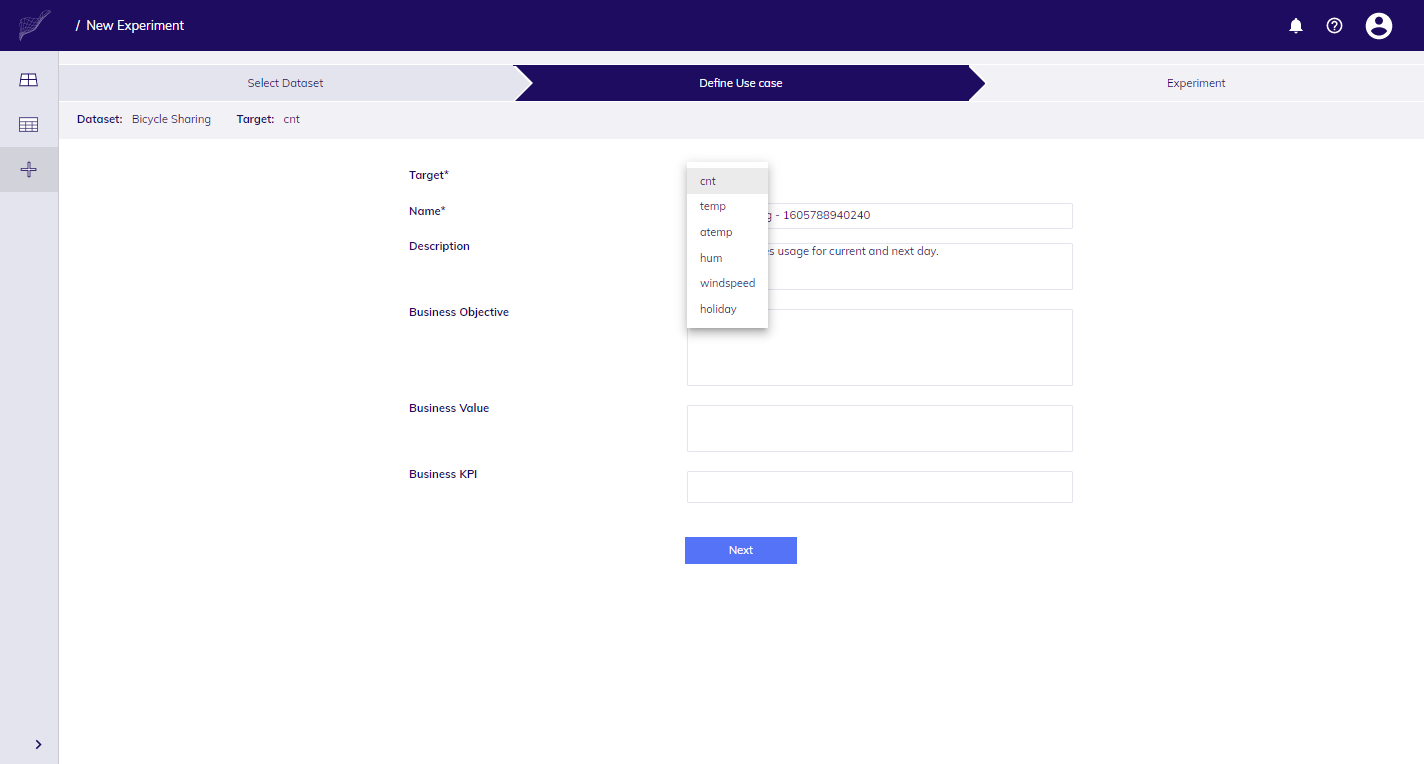
on the 2nd page fill in parameters that will describe our Use Case: Name, Description and business fields (objective, value, KPI); then provide parameters for the first Experiment of your Use Case - Target variable, which in our case is cnt; when finished, click on Next button,
you landed in Experiment Workbench screen with chart in central part, Settings task pane at right hand side, top bar where you can see Dataset name, Dataset version (versions are added with the update of Dataset), target name, Experiment name, and Iterations panel at the bottom, which is by default collapsed,
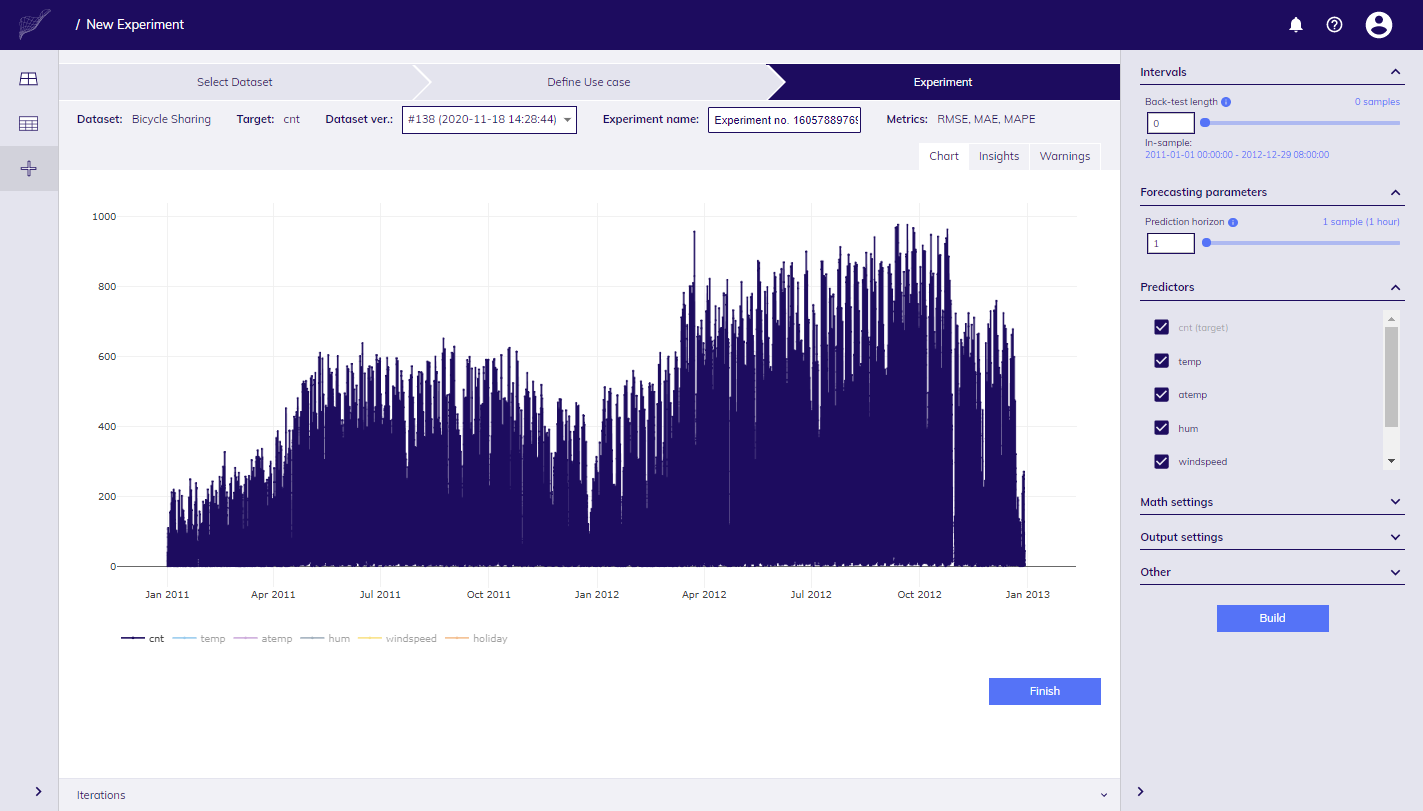
in Settings task pane on the right, define Back-test length (in-sample and out-of-sample intervals are derived from this setting) to obtain results for out-of-sample interval (if you keep it to 0 just in-sample interval will be used),
our goal is to simulate how prediction at 10 AM would look like for the current day and next day, that makes 39 points to be forecasted because the last value for cnt is at 8:00 (15 hours for current day and 24 for the next), set Prediction horizon to 39 and click on Build button;
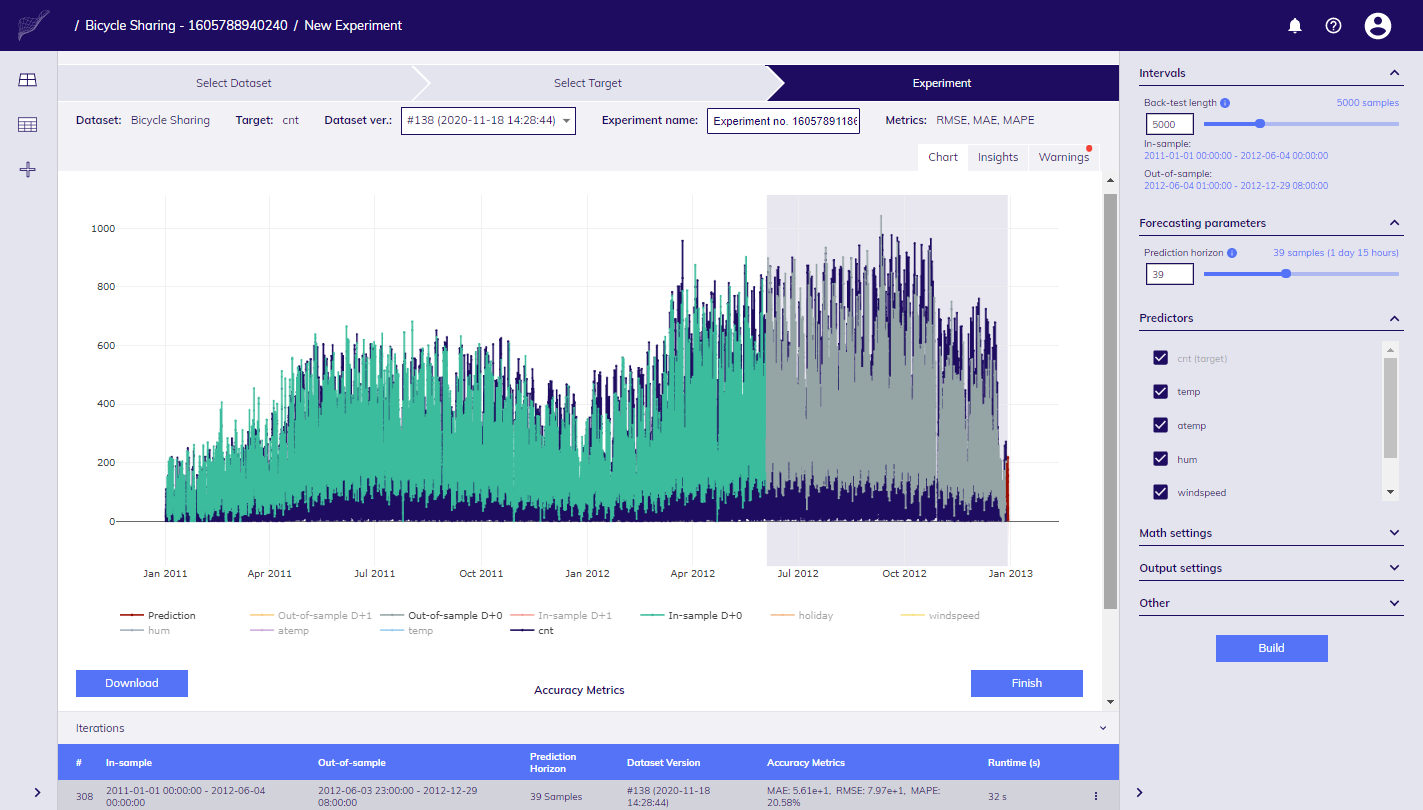
in a few moments new data is added to the chart with results from TIM Engine, you can see how well it fitted original data (out-of-sample interval), our result covers prediction for current (D+0), and next (D+1) days, by default only D+0 values are shown in chart,
 Experiment Workbench
click on Insights tab to inspect feature importances, and Sunburst diagram with features of models in Model Zoo (group of models generated by TIM Engine),
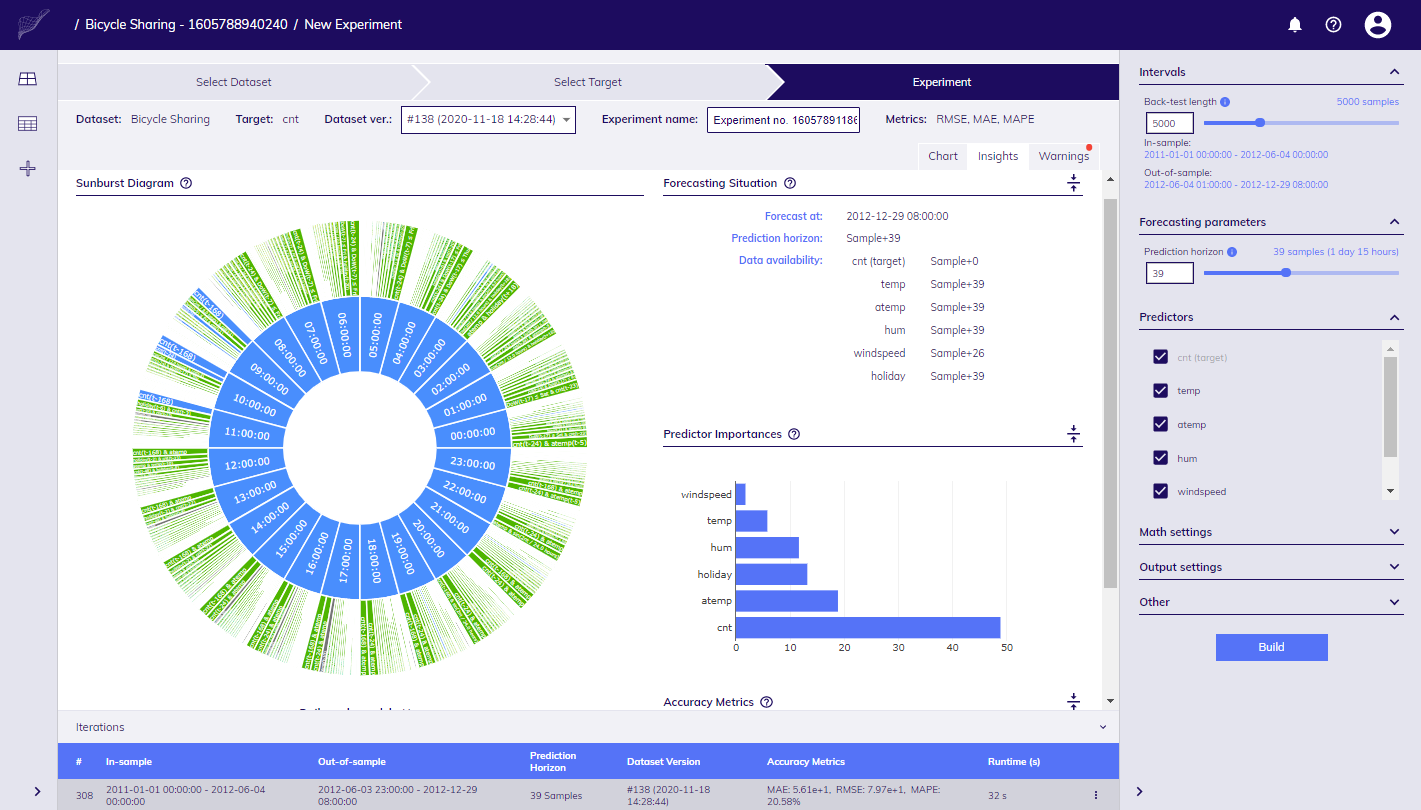 Insights panel
accuracy is measured with MAE, MAPE, RMSE metrics by default and is calculated automatically every time you rebuild the model/re-run experiment - or better to say, you create new Iteration of experiment.
This concludes your first Experiment.
Fine tuning settings
Let's set benchmark first without adjusting any settings (rely fully on automatic) so we have reference point that we can compare to in later iterations, then iterate over by adjusting settings and compare:
- click on Build button,
- in a few moments, new Iteration is created, chart will get redrawn, new metrics are shown, Insights tab offers new details,
- if you unfold Iterations panel at the bottom, you'd notice there are now two items, click on one of them, content in rest of the screen get updated with respective details, to create new Iteration, just change some of the parameters in Settings panel, lets say, we'd like to manually override Complexity level (unfold Math settings section to adjust Complexity) and set value to 50, click on Build button,
- in a few moments results are available,
- we are still not sure with the result, what about 40, set value to 40, click on Build,
- new results get displayed shortly.
This way you can iterate over various settings and compare what impact has individual change on the result/accuracy.
Getting to Production
Let's say that we proved that the first Iteration delivered the best results, and we get comfortable this is the right set of settings to go with and use it in regular forecasting, or production:
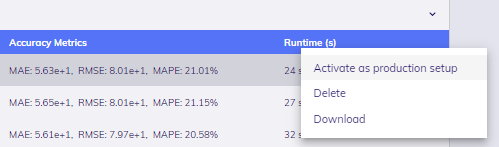
click on the first Iteration in Iterations panel, find three dots icon, click on it,
in the context menu select Activate as Production setup,
now, click on Finish button, you will land on parent Use Case page that was created within Wizard,
go to Production tab, you will find one Production setup created which can be used for regular forecasting.
You are prepared for production forecasting, let's see how to forecast.
Regular forecasting
Our scenario expects to forecast every day at 10 in the morning, let's say we want to start forecasting in TIM Studio, later we will talk more about how to automate every-day routine of forecasting.
Imagine that next morning, you have new version of data available, and you'd like to use it create your first forecast.
in Dashboard, look for Production settings section, look up the one you created and click on it,
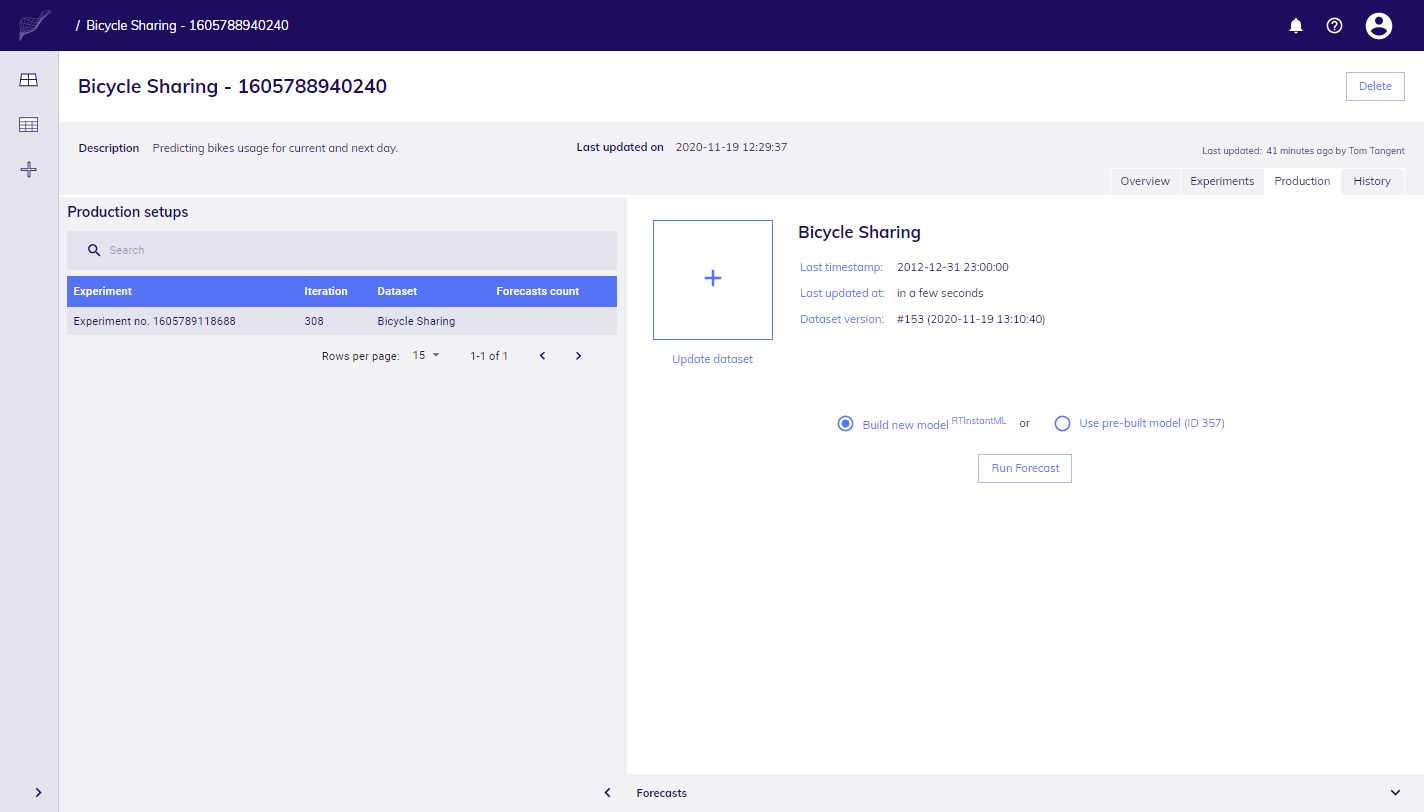
you arrive to Production tab, click on first item in the list, controls to create forecast are shown on right hand side,
at this step you can update Dataset (e.g. if you would get new values for predictors), click big plus tile and select this file update of Dataset will start,
by default, you are given option to build the new model during forecasting process - this will cause that TIM will build new model based on settings from your Production setup and new data you uploaded, this would make sense if shape/availability of your data would differ from the situation during experimenting, or you believe new data can contain structural changes thus generating new models is important,
click on Run Forecast button, monitor progress, in a few moments chart with new values is shown, click on Download / Download forecast to get data in form of CSV file,
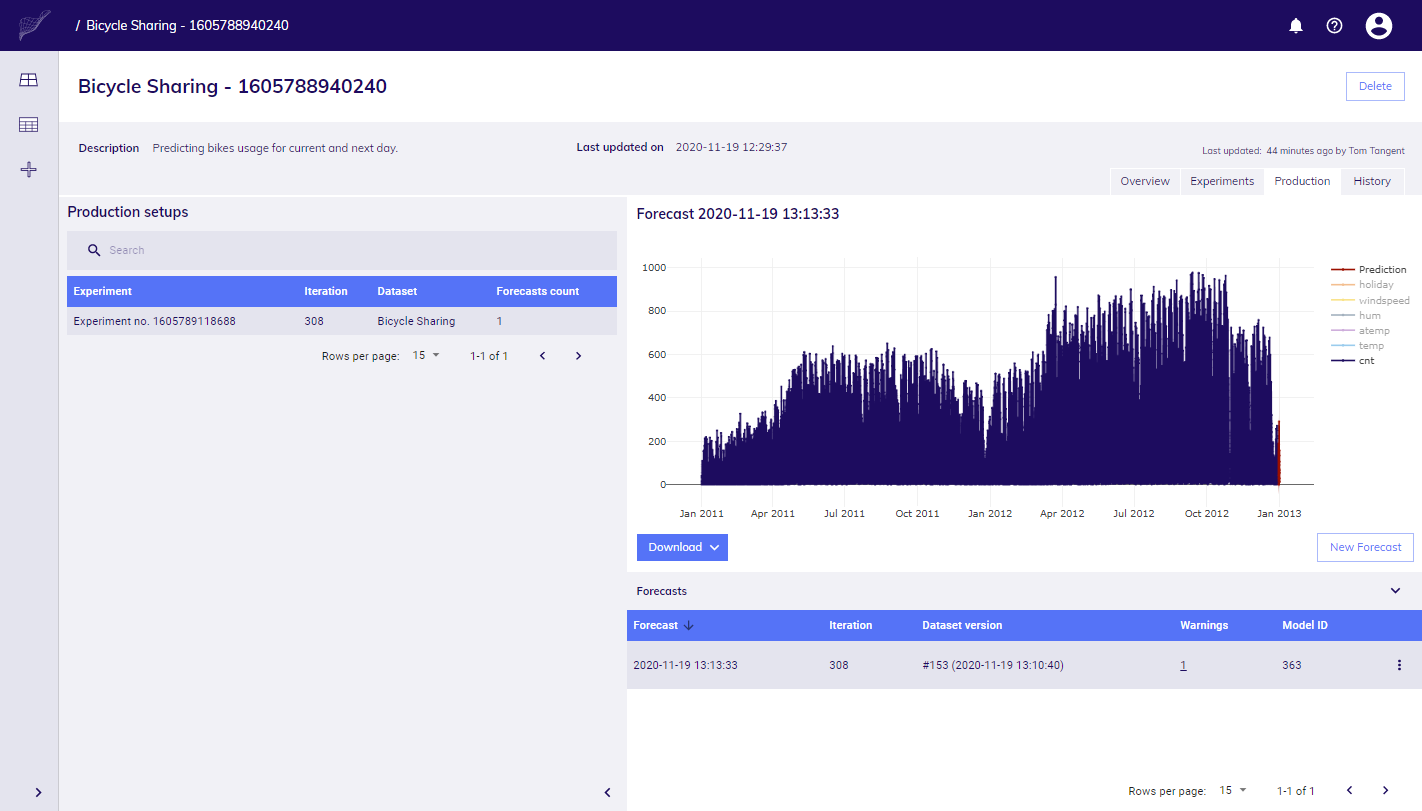
your forecast was added to the list of forecasts below, each time you create new forecast, it will be added here,
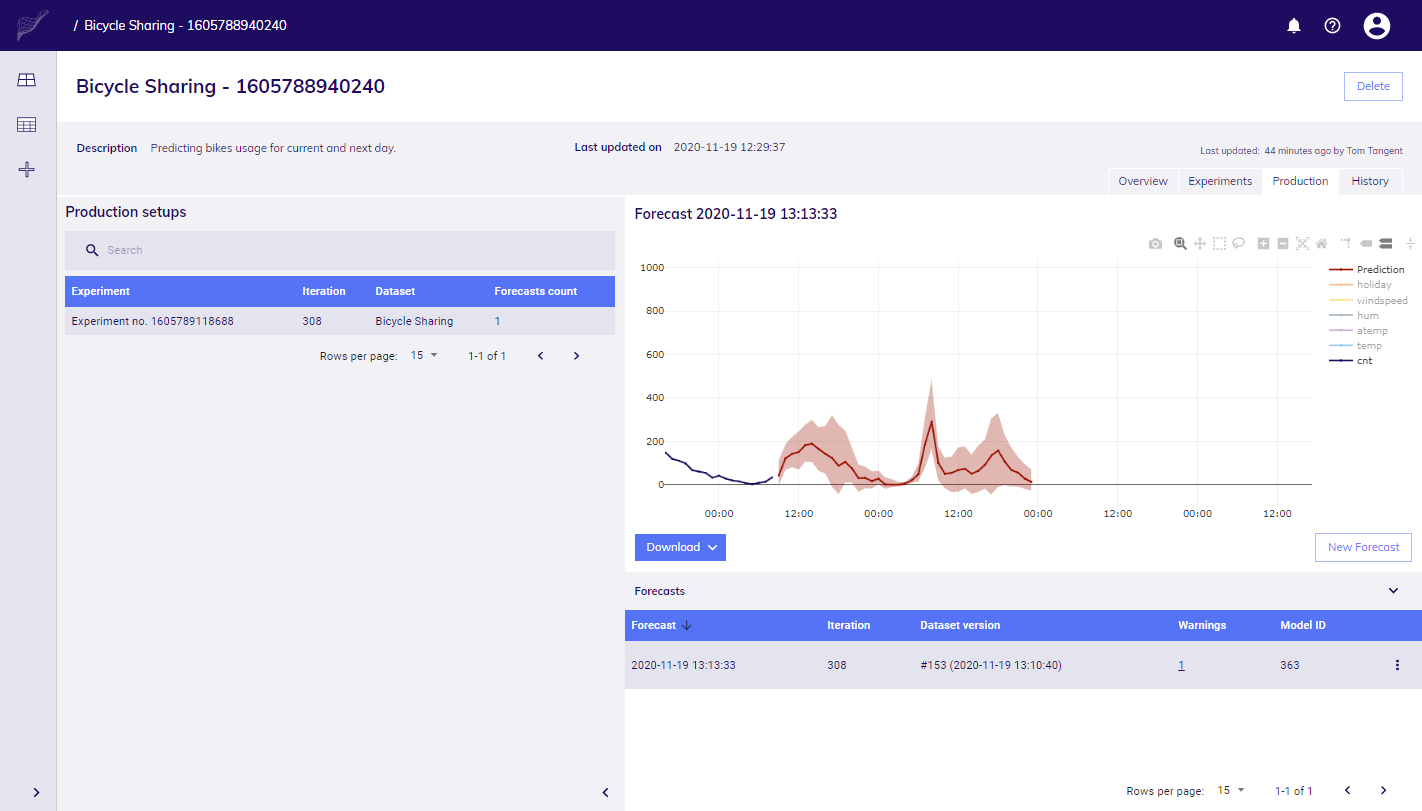
zoom in to prediction in chart, or download data as CSV from Download menu available below chart.
This concludes your introductory journey in TIM Studio. If you are interested, check the last section to learn more about how to automate forecasting with TIM Studio API.
Automating your routine
TIM Studio API is being prepared and will be available soon, here's how it will work.
The API end-points will enable forecasting with existing Production setups, and update of Dataset.