Exploring a Dataset
TIM Studio allows you to store your Datasets and keeps track of changes (versions).
Datasets list
To see list of available Datasets click on Dataset icon in the left bar.
You can easily search through by name, column names, source type etc., filter or sort by various criteria.
List contains following columns:
- ID
- Name
- Source
- Sampling Period
- Length
- Columns Count (incl. timestamp column)
- Columns
- Public Holiday Column
- Last Timestamp
- Last Update
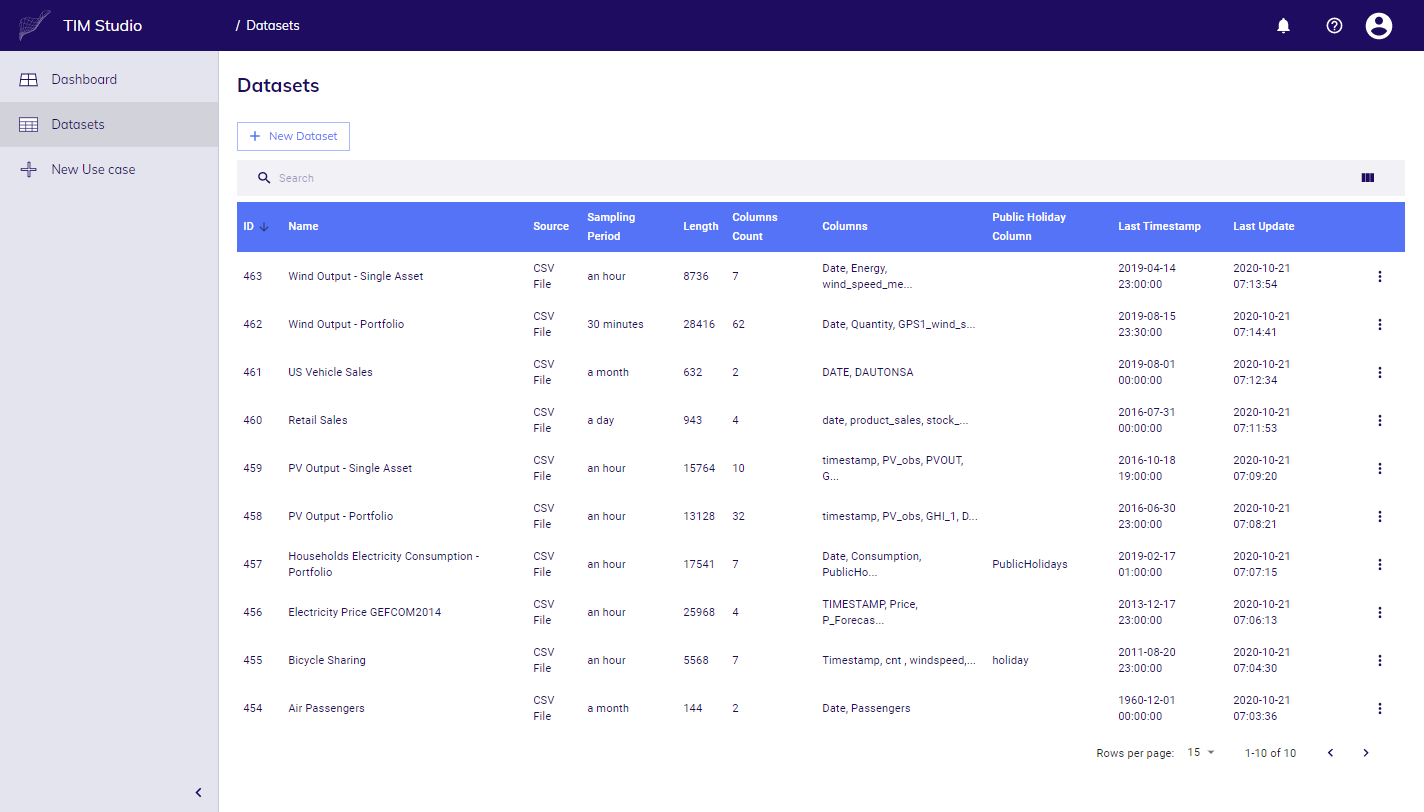
List of Datasets
Details of Dataset
To see details of Dataset, navigate to list of Datasets and click on the one you are interested in.
You can find global information about Dataset, such as number of rows and columns, time of last update, type etc.
Overview tab
In the very first tab you can see data plotted in line chart.
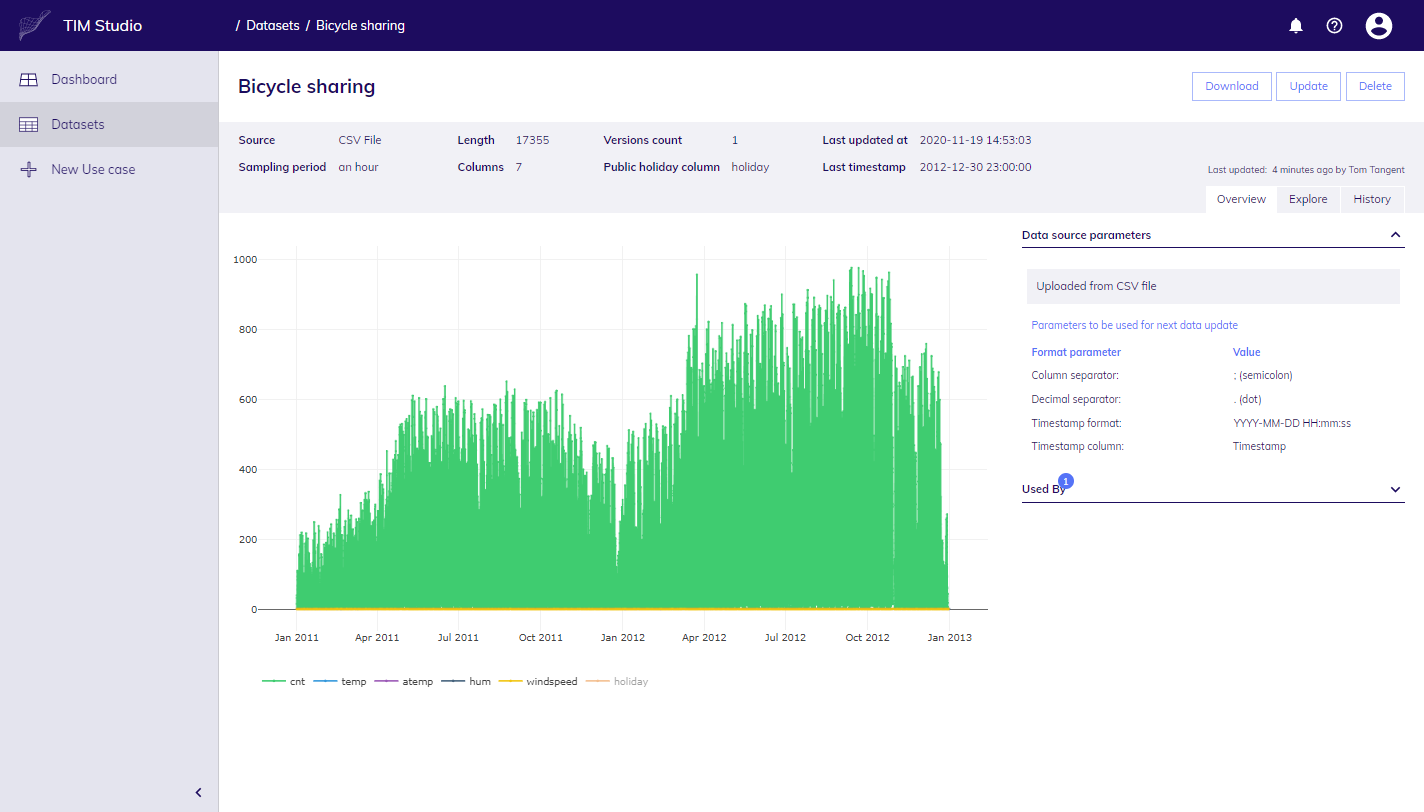
Dataset detail - Overview
Using chart
By default, chart shows first 5 columns of your data.
It is possible to switch off and on all columns. Please be aware that if there are too many points to be rendered (too many columns selected), response can get slow.
Chart offers way to render normalized view. That means that if Column A has values for example on order of millions, while Column B has values < 1, it is possible to see both of them as with naked eye, otherwise Column B values would be seen as straight line (as its values are that small compared to Column A). It is possible to switch off normalization and see "actual" values.
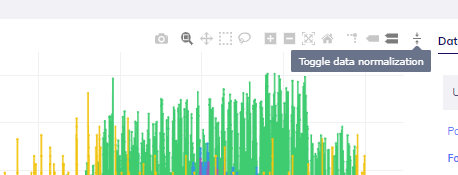
Toggle data normalization button
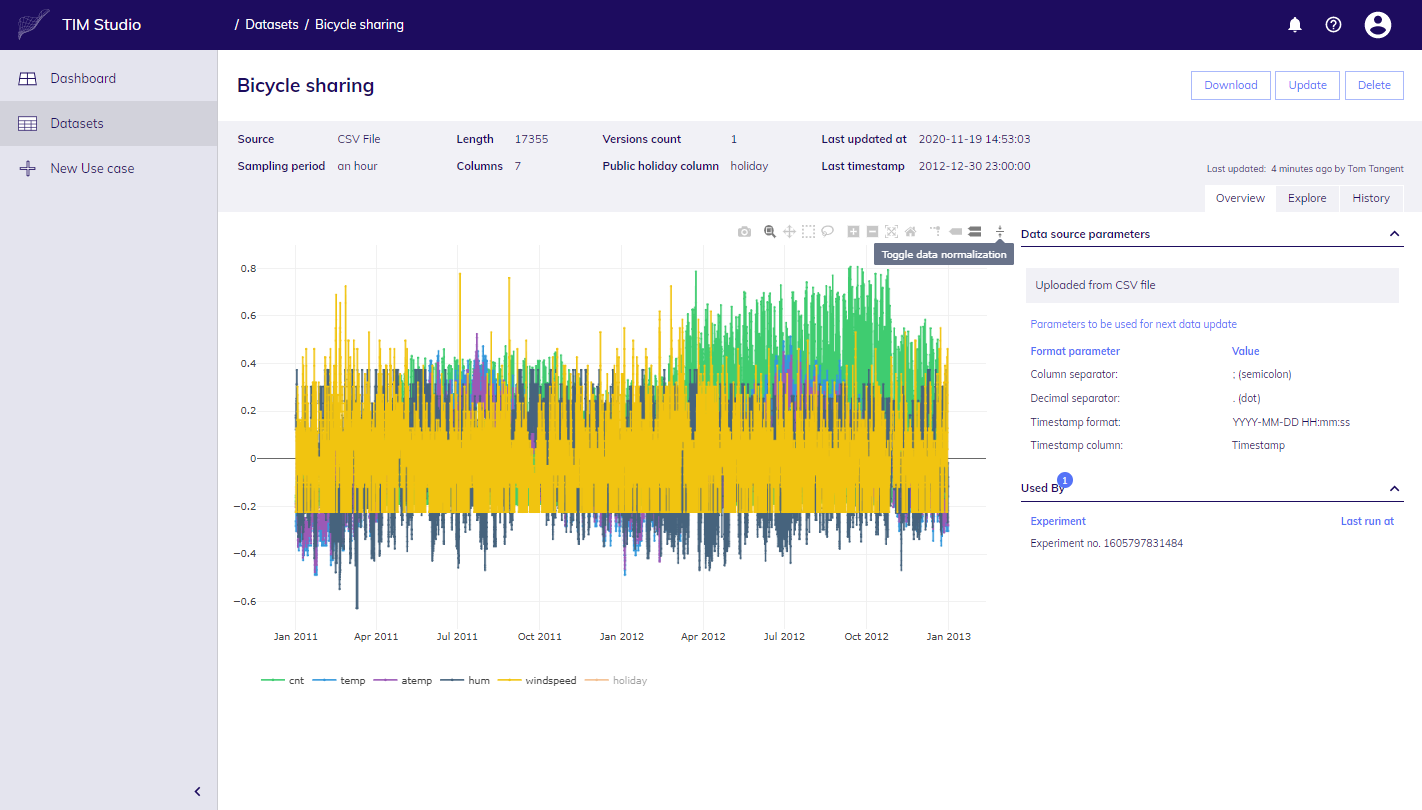
Normalized chart
To zoom-in on interval of your choice, selected range on chart, chart will refocus on desired interval. To click on chart and chart zoom-out, double will refocus on original interval.
Data source parameters
There are shown also details related to data source:
- Manual upload is shown for files uploaded from hard drive,
- SQL server connection details are shown for Dataset created from SQL tables.
Used by
If Dataset is used by some Experiment, it is shown in this section. You can easily navigate there by clicking on its name.
Warnings
Warnings section appears below Used by whenever there is warning related to your Dataset.
For example, TIM Studio allows you to store Datasets that are bigger than those allowed to flow into TIM Engine (to build models, or forecast), if such situation occurs, you are shown warning message in this section.
Explore tab
Second tab provides tabular view on data.
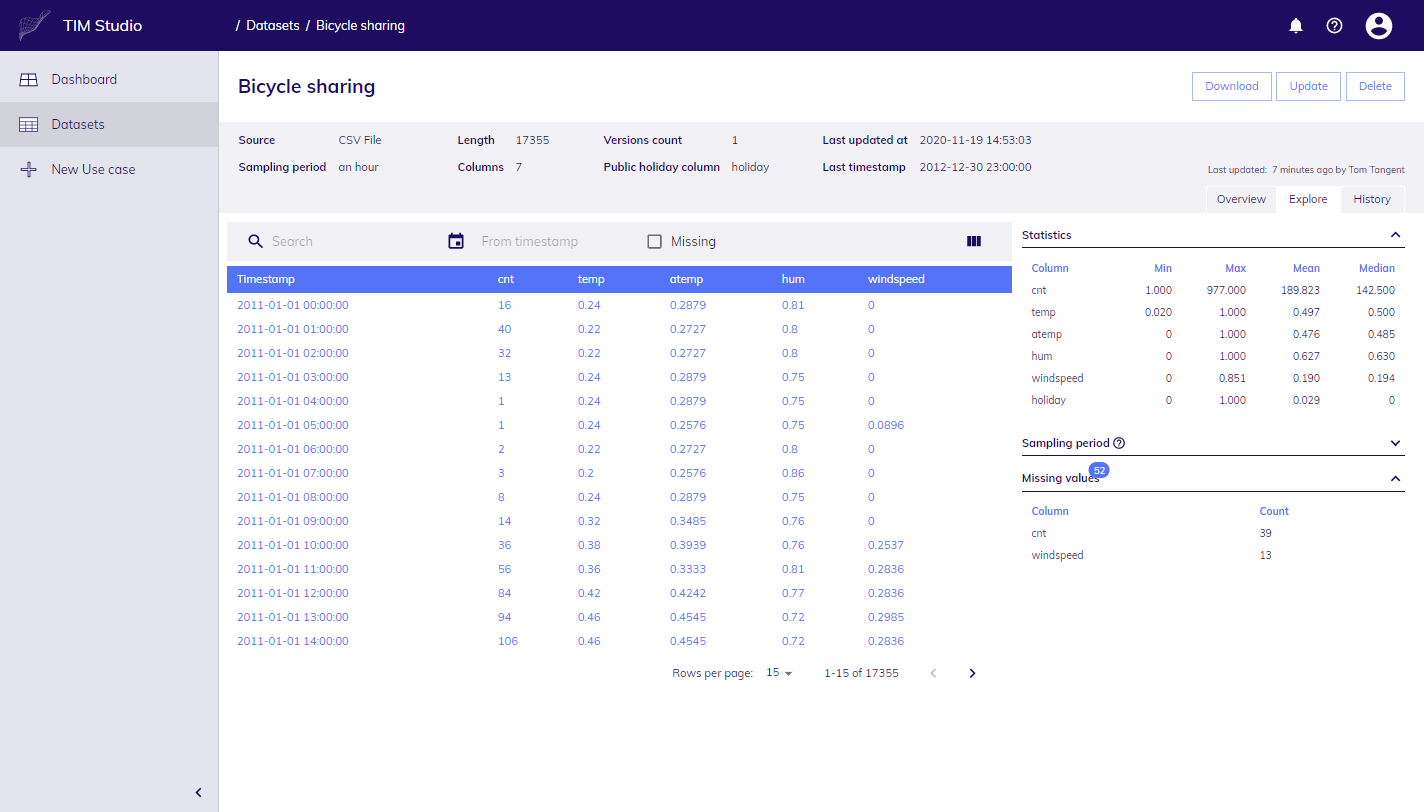
Tabular view, quick statistical insights, missing values per column
You can navigate to any part of Dataset by selecting timestamp in calendar picker (which will show data from that very timestamp), or by sorting it by timestamp.
Sorting is enabled for all columns. Datasets with too many columns would not show all of them at once, so if you do not see any column try to select visible columns first.
It is possible to look up for particular value via search which search across whole table.
If you'd like to see where exactly are missing values, if any, check the checkbox to show missing values.
Statistics
You can check insights into data at right hand side: statistical information (such as min., max., mean) for each column, or see how many missing values are there in each column.
Missing values
Missing values are not a good thing, although TIM engine can help to impute values for you, read more about it here
Sampling period
Sampling period section provides insights into why TIM Studio shows certain value in Sampling period field, and what does IDC mean. Read more about detection of sampling period, what are the implications to functionality and results.
History tab
The last tab offers view on History of changes, so it is possible who and when changed, or created Dataset.
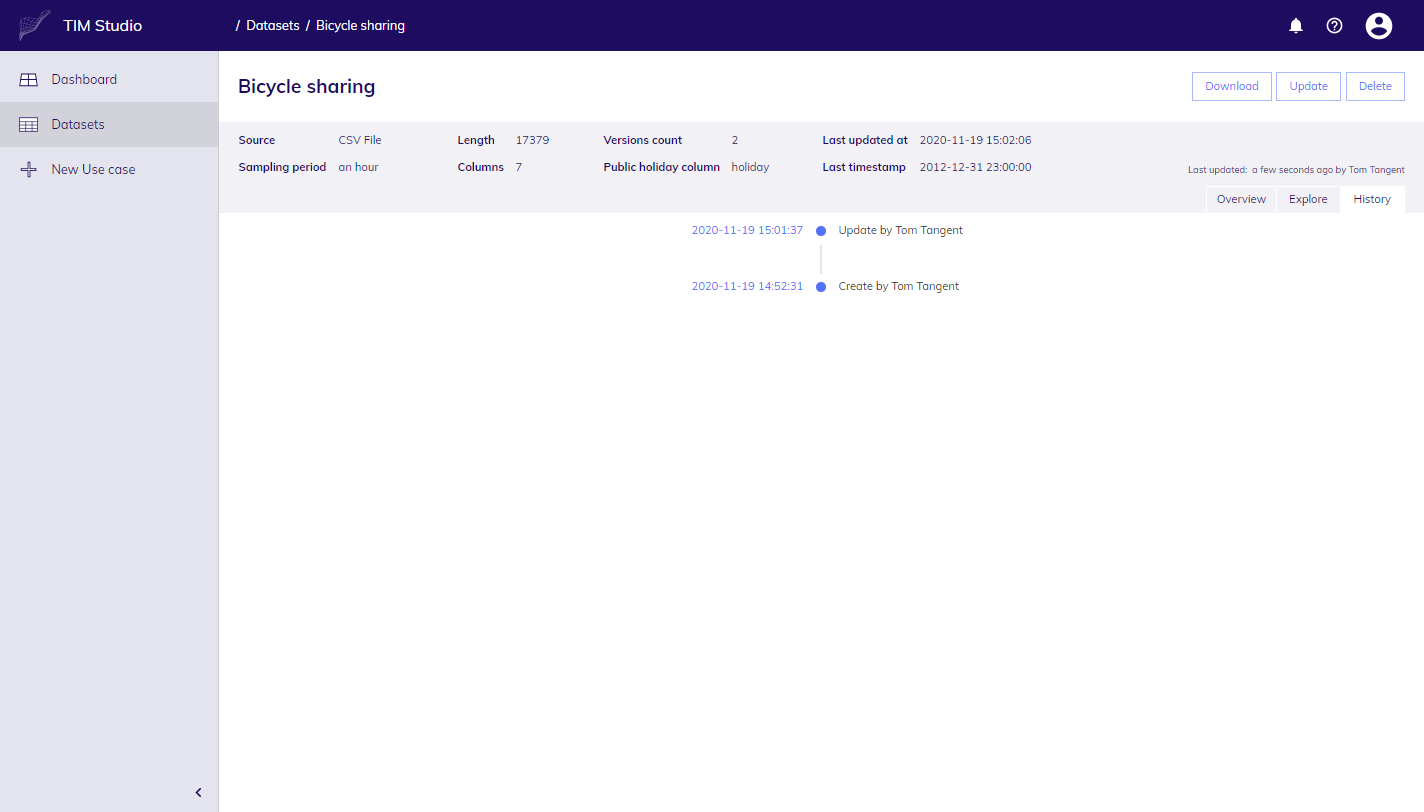
History of Dataset