Creating a New Forecast
There are two ways how to navigate to your Production setup:
- in Dashboard, look it up in Production setups section,
- or navigate to Production tab of your Use Case and select particular Production setup.
![]()
Regular forecasting based on Production setup means Ops in the MLDevOps concept and yet, if you choose the RTInstantML option, you basically run Dev and Ops in single pass. Hyper automated.
How to calculate forecast
Once you arrive to Production tab, you are given list of available Production setups across all Experiments.
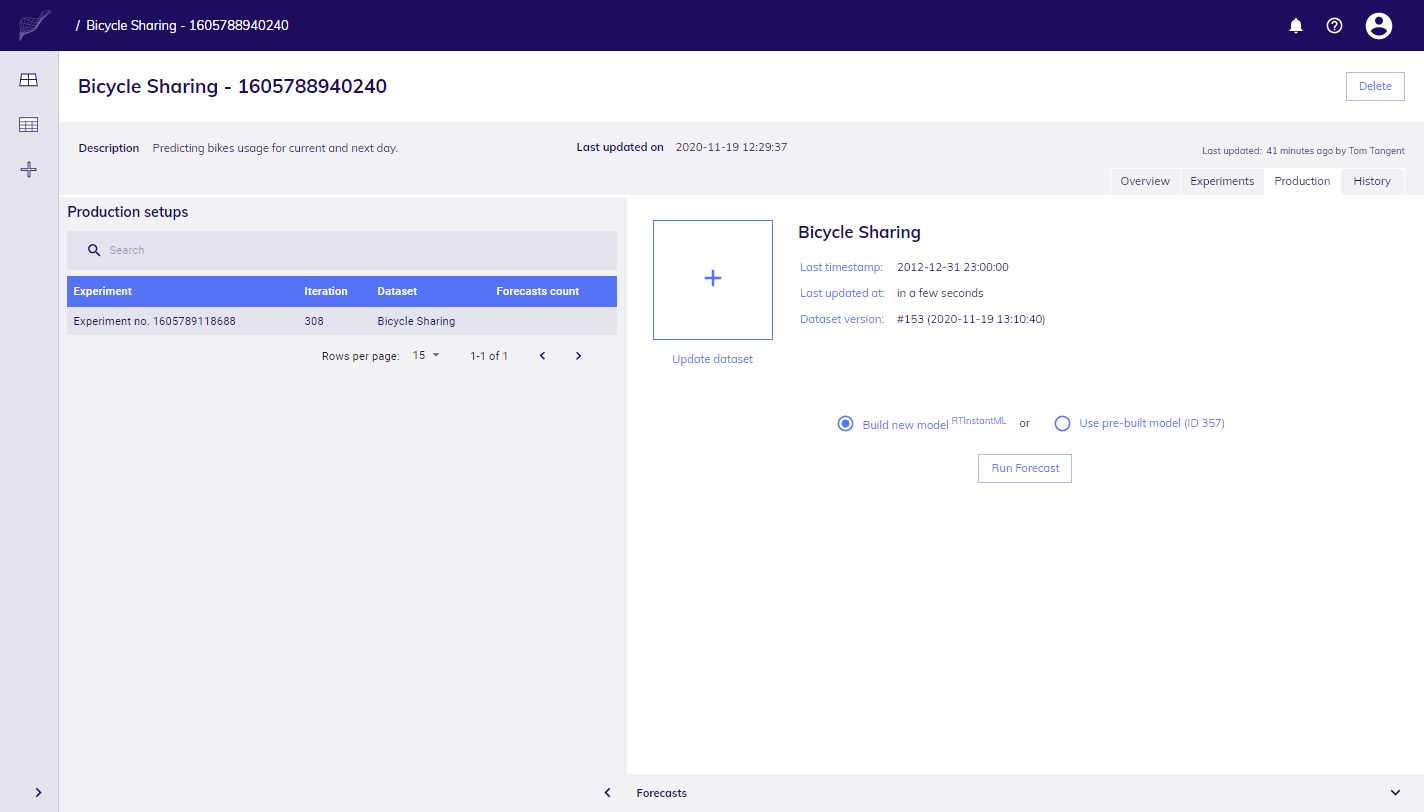
Landing screen of production setup
At this step, you can see details of the latest version of Dataset that will be used for forecasting, its update time and last timestamp of target. You are also given option to update it prior forecast calculation if you will.
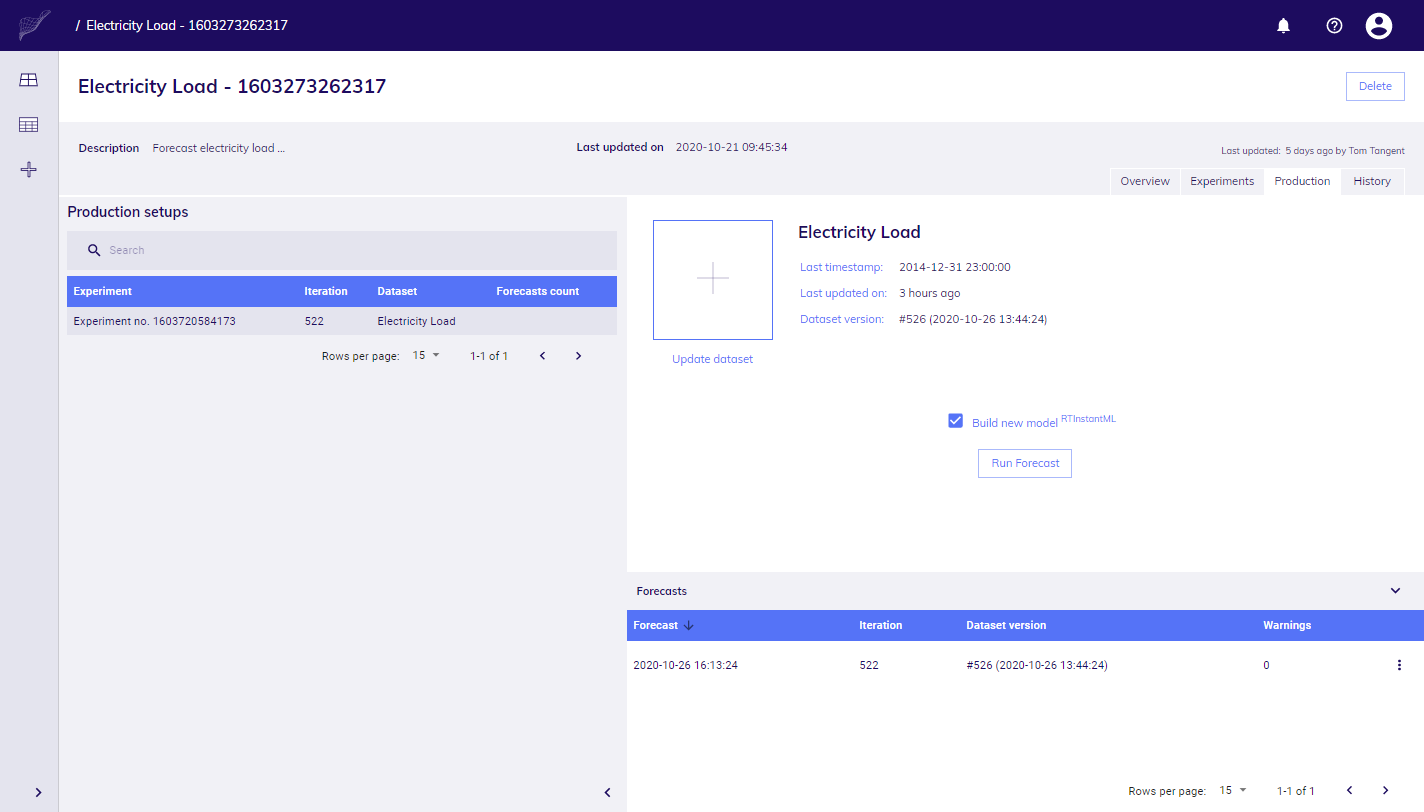
To initate calculation with the existing model just click on Run Forecast button. In a few seconds calculation will start.
You may want to not rely on existing (pre-built) model, for example if you expect forecasting situation (data availability) changed. In such case the best option is to rely on RTInstatnML - i.e. build new model for your current forecasting situation. To initiate calculation with RTInstantML just leave radio button selected on its default option - Build new model and click on Run Forecast button.
Calculation in progress
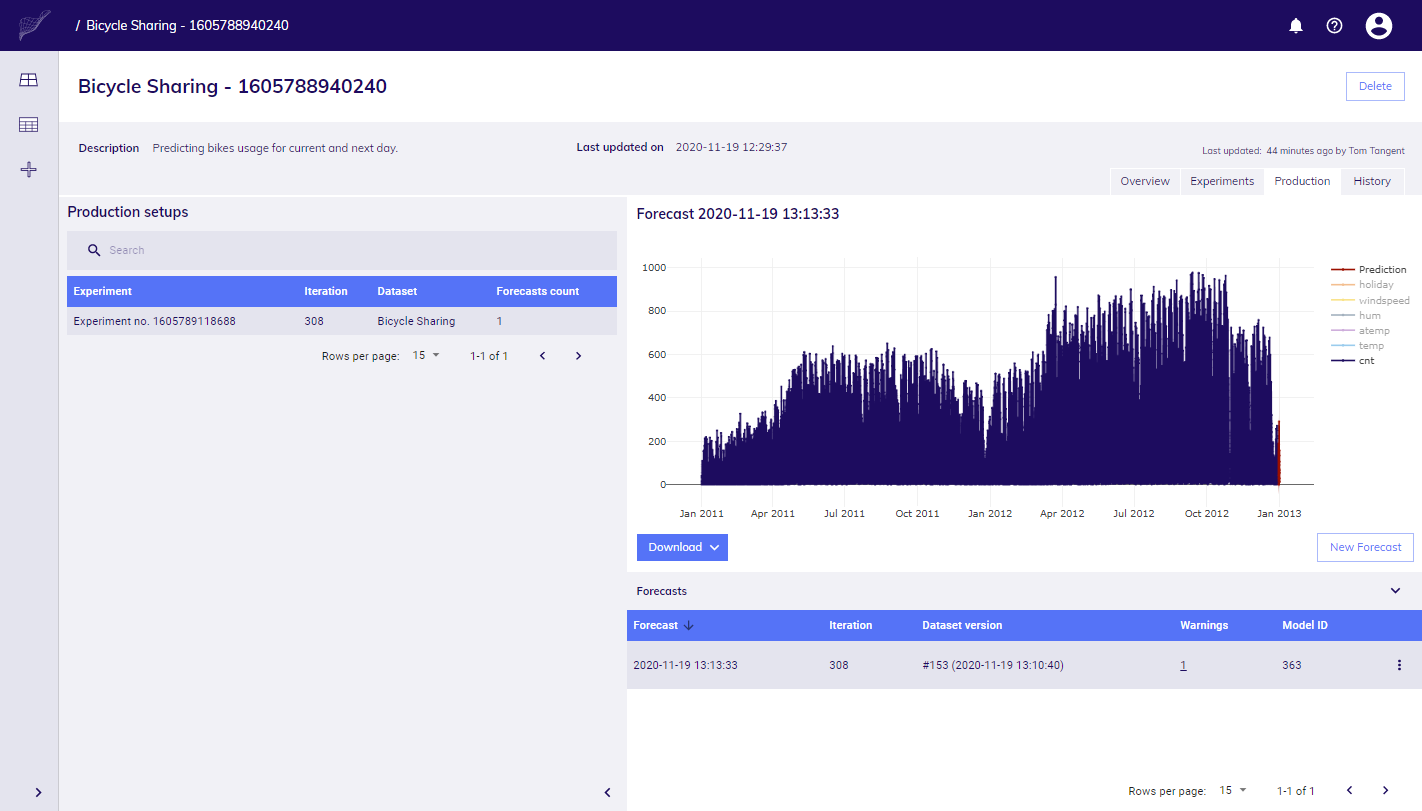
Once finished you will see results displayed in chart. Predicted values along with the input data.

Results with input data
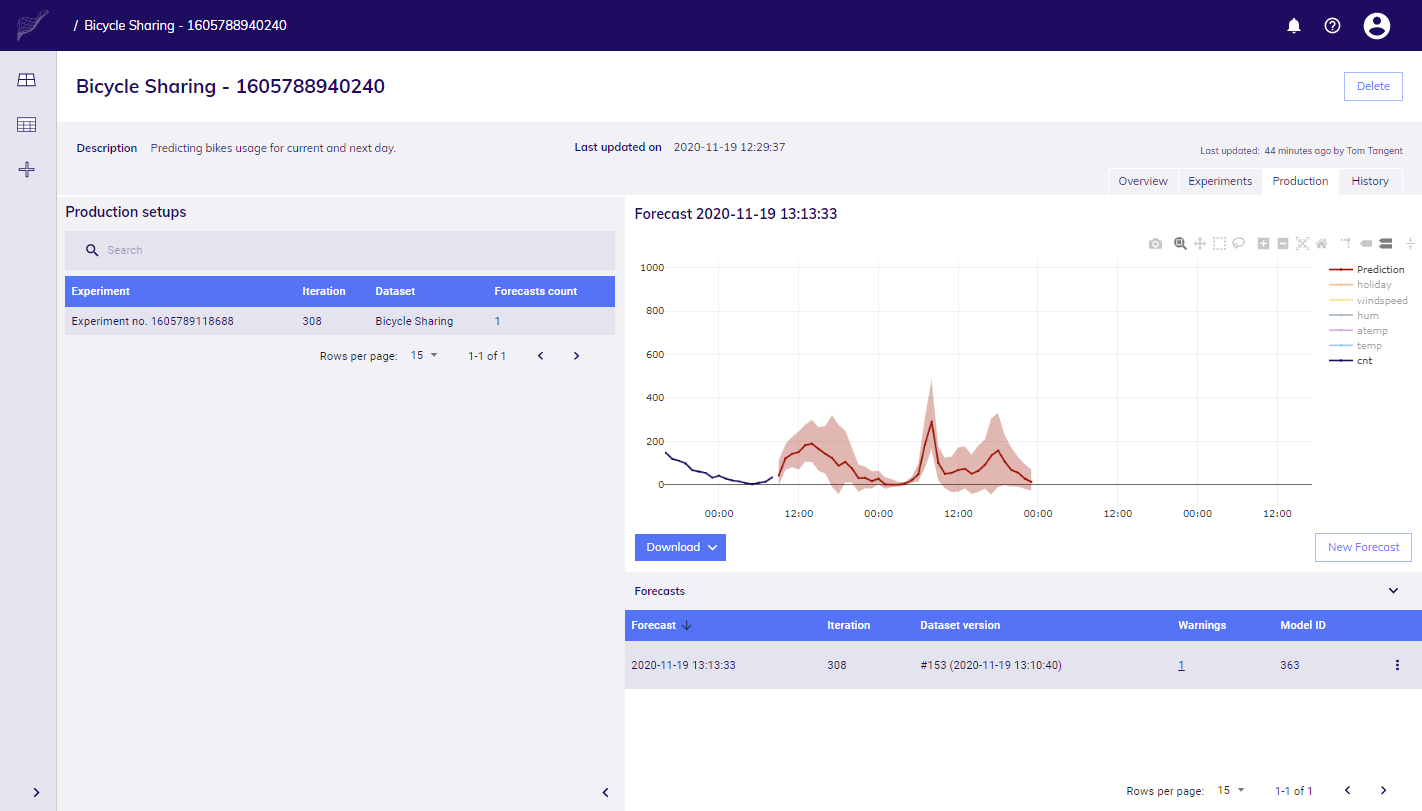
Once calculation is finished you can see results in chart. Zoom in to see details, including prediction interval values.
Forecast with prediction interval values
In case you'd arrive to Production and there is already existing forecast for forecasting situation you are in due to the same data or settings.
Warning message
Consuming results
When forecast calculation is finished, you can see predicted values. If you used RTInstatnML you will see also prediction intervals (for 90% confidence interval).
Chart
Predicted values are plotted on chart along with the input data. To see predicted values better, zoom in on chart.
Download as file
You can download values in form of CSV file. To download results as CSV, click on Download button.
Warnings
Pay close attention to any warnings returned. They can contain important message for you.
For example, imagine you pre-built model with values of predictors of certain availability, however, most recent version of Dataset contains values that have bigger gap with respect to target, in such situation, accuracy of forecasted values can suffer.
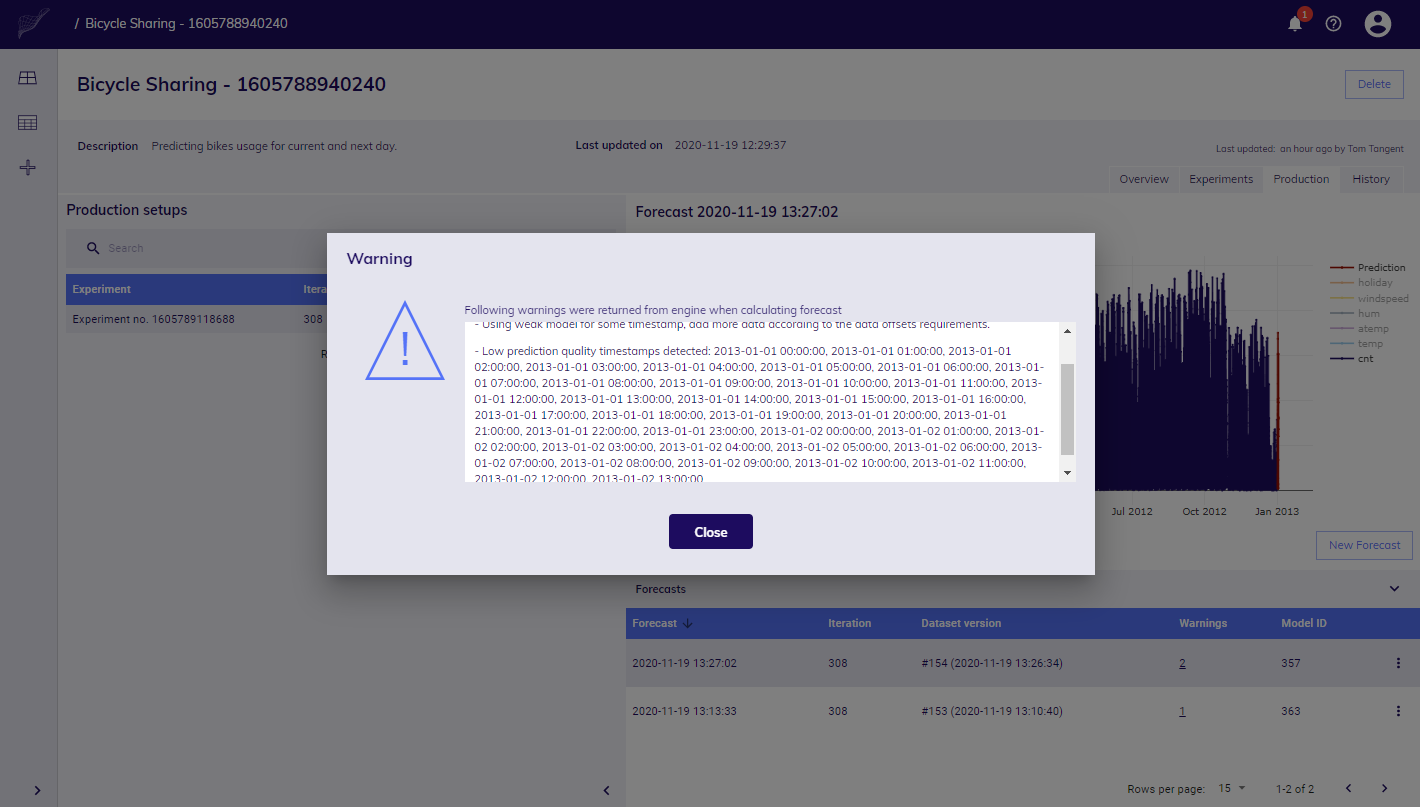
Warning details
Automation
If you need to run forecasting more often, you may need to automate it. It will be possible by implementation of TIM Studio API and orchestration. This means that you will be able to prepare and/or manage your Use Case, Experiment in TIM Studio, and do regular data update and calculation of forecast via API.
TIM Studio API is not available at the moment, check Roadmap article to see when it will be available.