Evaluating Results
Once TIM finished its model building and calculations, results are populated in central chart, Insights and Warning tabs.
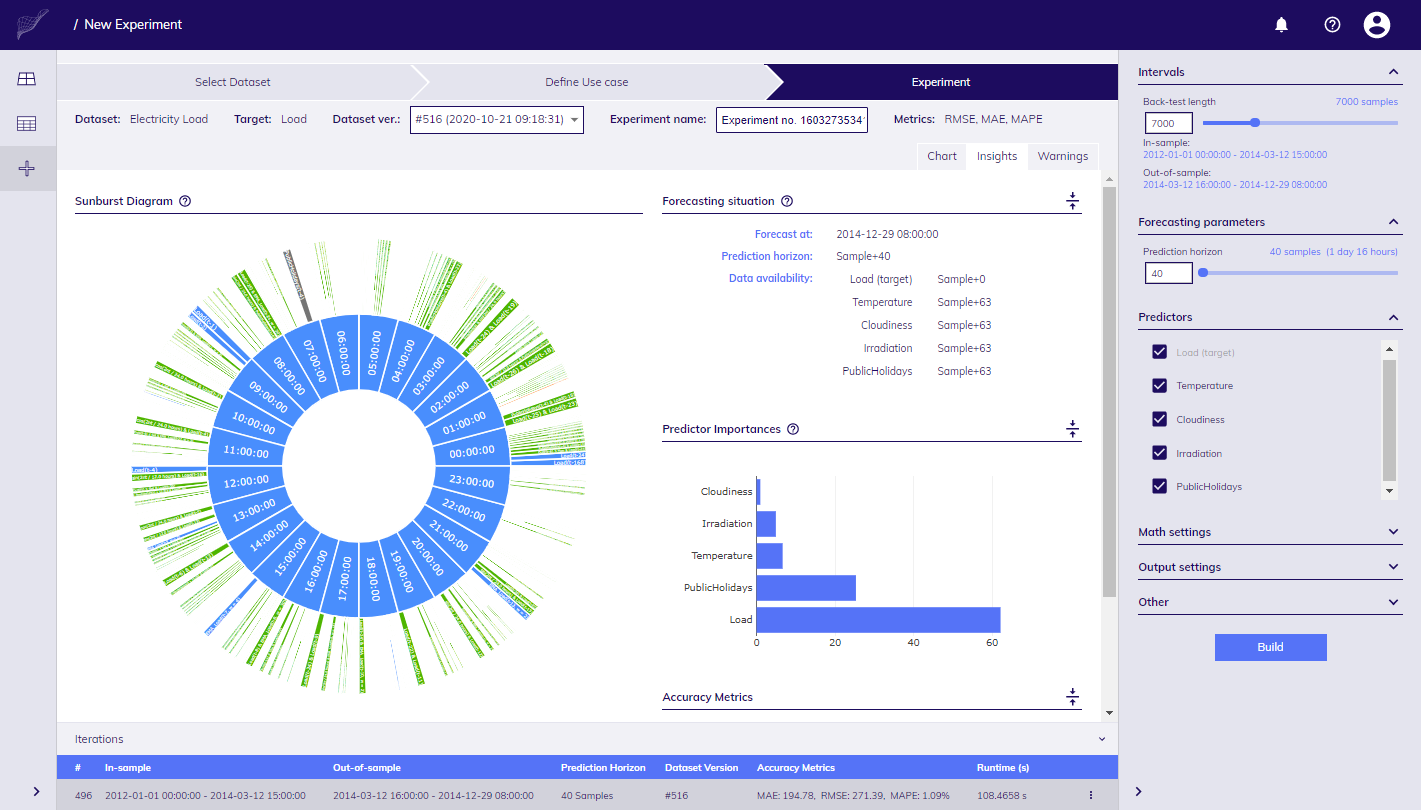
Insights panel
Insights
Insights tab provides details about:
- models built,
- forecasting situation snapshot,
- importance of individual predictors,
- accuracy metrics.
Models
You can obtain deep insights to models by inspecting Sunburst Diagram which renders components (features) of sub-models generated. We say sub-models, because TIM can generate multiple models, so called Model Zoo, which contains tens or even hundreds of models.
Detail description of terms displayed in features of sub-models is available when clicked on ? icon above diagram.
To navigate show more details of individual segment, click on it, diagram will zoom in to show another level of detail, click to central part to navigate back.
Forecasting situation
Forecasting situation is described by the following parameters:
- Timestamp at which you make forecast - this is the timestamp for which the last target value is available (last target timestamp), e.g. at 2020-02-28 08:00:00.
- Availability of data for each predictor with respect to the last target timestamp, e.g. Sample + 24 means that predictor values are available 24 steps ahead of the last target value.
- Prediction horizon - how many steps ahead from the last target timestamp you are predicting, e.g. Sample + 48 means you are going to predict next 48 steps.
You can find snapshot of Forecasting situation in Insights tab when results of Iteration are known.
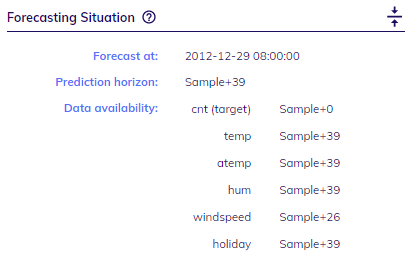
Snapshot for forecasting situation
To give you another perspective, the image below shows how the situation with data would look like if you'd use spreadsheet software.
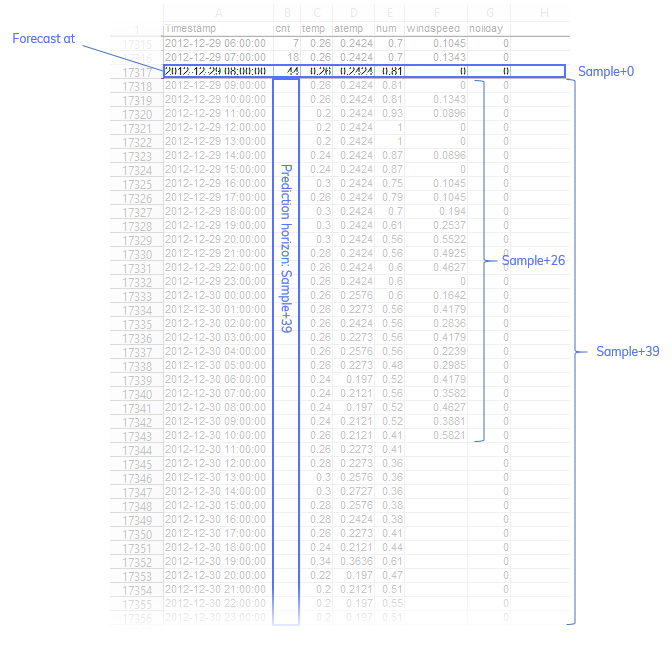
Snapshot of situation in spreadsheet
Predictors importance
If you'd like to understand how particular predictor (column) in your Dataset contributes to explain variance of your Target relative to other predictors then Predictors importance chart provides the answer.
Accuracy metrics
You can see metrics below the main chart, in Insights panel and shortened version also in Iterations panel.
By default, TIM Studio shows following metrics for both in-sample, and out-of-sample intervals:
MAE - mean absolute error
MAPE - mean absolute percentage error
RMSE - root-mean-square error
 Metrics for data with daily cycle
If you'd like to evaluate different criteria (e.g. if values are not calculated beyond certain threshold value), it is recommended to download results in form of a CSV file - it can be done per each Iteration (in Iterations panel).
Depending on if data are treated as "daily cycle", or "non-daily cycle" you'd see metrics grouped by day (D+N), or sample (S+N) with rolling window (RW+prediction horizon length).
D+N means days within prediction horizon, e.g. evaluation for same day and day ahead would be labeled as D+0 and D+1.
S+N refers to the samples within prediction horizon, e.g. S+1 means the very next point predicted from the target, S+2 is the second point etc.
Daily cycle vs. non-daily cycle models
TIM takes different approach to data that follow daily cycle and other. This has impact on what results are returned.
Daily cycle
For data that TIM recognizes as daily cycle data metrics are shown with "D" prefix to denote to which day in prediction horizon evaluated points belong to. For example, if your prediction horizon spans through 2 days starting in the middle of the day, you'll see D+0 and D+1. Values for current (intra-) day are shown with D+0, values for next day as D+1.
Components of Sunburst Diagram are grouped by 0-23 (as hours of the day).
When TIM calculates accuracy metrics it uses rolling window of 1 day.
Non-daily cycle
For data that TIM recognizes as non-daily cycle data metrics represent accuracy of all points predicted in given interval with rolling window. Rolling window has length of prediction horizon.
Components of Sunburst Diagram are grouped by the distance of sample from target in prediction horizon, i.e. S + 1, S + 2 ... S + prediction horizon length.
Results in Chart
When you arrive to Experiment Workbench, you can see chart with values from Dataset for version selected.
After your Experiment Iteration retrieve results from TIM Engine, it will show predicted values for in-sample, and out-of-sample intervals along with the original values so you can compare them.
Anytime you change focus to different Iteration, by clicking on one in Iterations panel, chart will be refreshed.
Warnings
Besides details about models and predictors, warnings can be returned by TIM Engine. If this happens red dot is shown in Warnings tab.
For example, if some of predictors is not used at all because it is not considered as useful, you will be informed about this in warnings.
See full list of potential error/warning messages from TIM Engine.
Tracking Iterations and comparing
Iterations panel shows list of previous Iterations of your Experiment. It provides information about:
- Iteration no.,
- Prediction horizon,
- In-sample and Out-of-sample intervals,
- Accuracy metrics (shortened version - the first out-of-sample block, i.e. D+0 or RW-N accuracy),
- Dataset version,
- Runtime in seconds.
If you click on particular Iteration in panel, all components on page (chart, metrics, Settings pane, Insights tab, Warnings etc.) get updated to show values for selected Iteration. (In case you try to modify Settings pane, or select different version of Dataset, you basically started to working on new Iteration and when you click on Build button, new Iteration is added to the panel.)