Backtesting and Iterations
The back-testing happens in the Experiment Workbench screen.
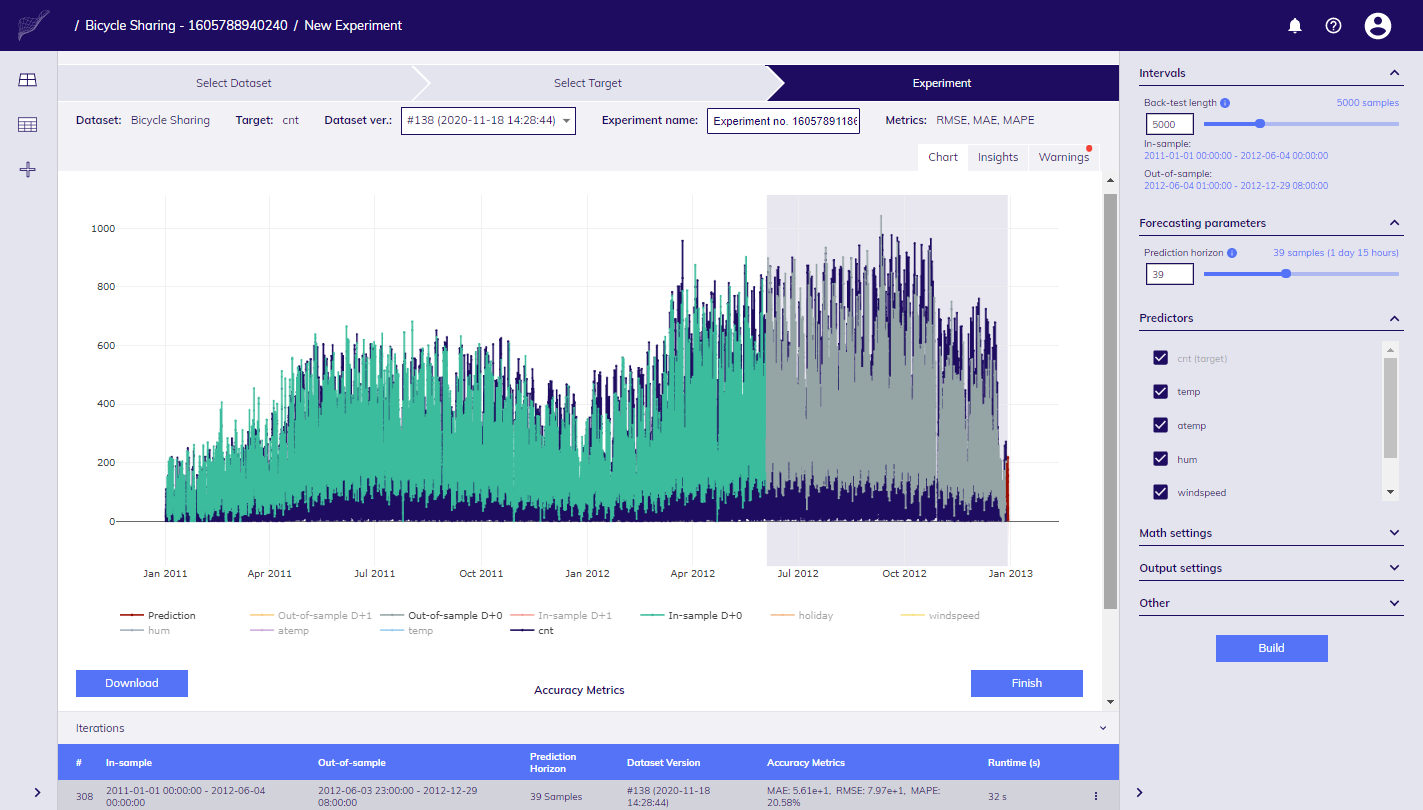
Experiment Workbench
Workbench screen
This screen is divided into several sections:
Top bar
Shows information which Dataset is used in your Experiment, which version, and what is Target variable (which column of Dataset is to be predicted). It also contains name of Experiment which is generated automatically, however you are free to rename it.
Settings pane
Located at right hand side. Offers you the way to configure settings such as intervals, mathematical parameters etc.
Iterations panel
Contains list of every Iteration built so far.
Central part
Contains multiple tabs so that you can inspect data visually, get insights into models built, see warnings etc.
Adjusting settings
Settings defined in (right hand) side bar basically influences what parameters are sent to TIM engine thus how models are built, and other important details.
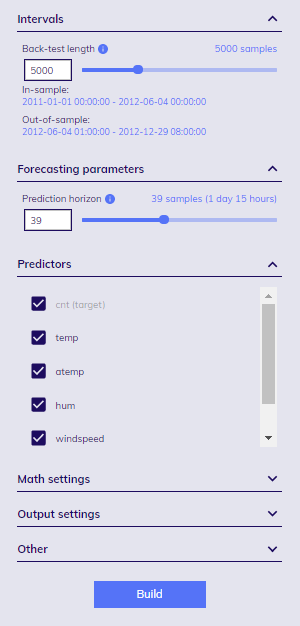
By default, most of the sections are collapsed, however you can change default values if needed
Settings are grouped in several logical areas.
| Group | Settings |
|---|---|
| Intervals | In-sample Out-of-sample |
| Forecasting parameters | Prediction horizon |
| Math settings | Normalization Allow offsets Complexity Time-specific models Dictionaries |
| Output | Min and max values |
| Other | Data imputation parameters |
Intervals
In-sample interval - defines interval of your Dataset which is used for model building.
Out-of-sample interval - defines interval used for evaluation of model built on In-sample interval.
It is recommended that ratio between In-sample and Out-of-sample intervals is at least 2:1.
Both intervals are calculated automatically by dragging slider for Back-test length. The whole Dataset is split into out-of-sample and in-sample intervals in the following process:
- at first, the last timestamp for which target value is available is found, this is set as end of out-of-sample interval,
- from this point N (Back-test length) steps backwards are taken to determine beginning of out-of-sample interval,
- all other points before it are set for in-sample interval.
Forecasting parameters
Prediction horizon is key parameter for forecasting, it must be > 0. It tells TIM engine how far from the last (target) timestamp to predict.
For example, if the last timestamp of target is 31.12.2019 23:00:00, data are sampled on hourly basis, and Prediction horizon is 4, then following timestamps will be predicted:
- 01.01.2020 00:00:00
- 01.01.2020 01:00:00
- 01.01.2020 02:00:00
- 01.01.2020 03:00:00
Math settings
Normalization
When switched on, predictors are scaled by mean and standard deviation.
Allow offsets
When switched off, TIM will not use any offsets, only the value of a predictor for a given timestamp.
Complexity
Determines maximal complexity of models, difficult datasets might require lower model complexity.
Daily cycle
Decides whether to use individual model building approach for different times within a day, switching it off leads to common model building approach for all timestamps.
NOTE: In some parts of the documentation you may find the term Time specific which basically refers to the same thing.
Dictionaries
TIM tries to enhance the model building process with new artificially created features derived from the original predictors, you can rely on automatic mode, or manually choose from the following dictionaries:
- Simple moving average
- Exponential moving average (not available when Allow offsets is switched off)
- Weekrest
- Day of the week
- Periodic components
- Intercept
- Piecewise linear
- Time offsets (not available when Allow offsets is switched off)
- Polynomial
- Identity
- Month
- Trend
More information about each of them can be found in Mathematical settings article.
Output
Allows you to set min. and max. value of predicted value.
Other
By default, TIM fills gap of max. 6 consecutive timestamps missing in your data. This can be adjusted with Data imputation settings.
Data availability
Not all data in your Dataset are available until the same timestamp in real life. Typically, there is delay of getting actual values for your target column, some predictors can contain predicted values up until end of your prediction horizon (e.g. weather forecast, or information about public holidays), some are lagging. To tell TIM what is data availability per each column, just upload Dataset as it would look like in regular (production) forecasting.
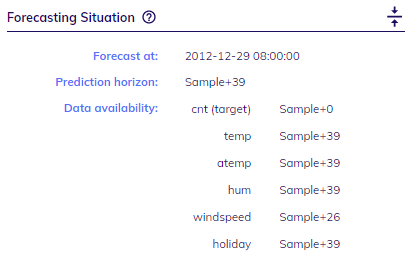
Forecasting situation
Data availability is very closely related to forecasting situation which is described by the following parameters:
- Timestamp at which you make forecast - this is the timestamp for which the last target value is available (last target timestamp), e.g. at 2020-02-28 08:00:00.
- Availability of data for each predictor with respect to the last target timestamp, e.g. Sample + 24 means that predictor values are available 24 steps ahead of the last target value.
- Prediction horizon - how many steps ahead from the last target timestamp you are predicting, e.g. Sample + 48 means you are going to predict next 48 steps.
You can find snapshot of Forecasting situation in Insights tab when results of Iteration are known.
Snapshot for forecasting situation
To give you another perspective, the image below shows how the situation with data would look like if you'd use spreadsheet software.
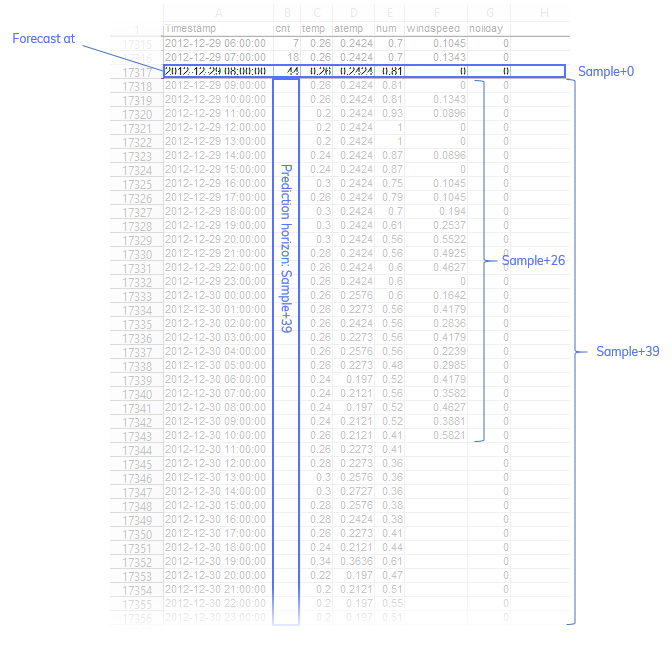
Snapshot of situation in spreadsheet
Changing version of Dataset
If you'd like to change version of Dataset you are experimenting with for next iteration, look for Dataset ver. field in the upper part of the screen. All versions uploaded to date are there.
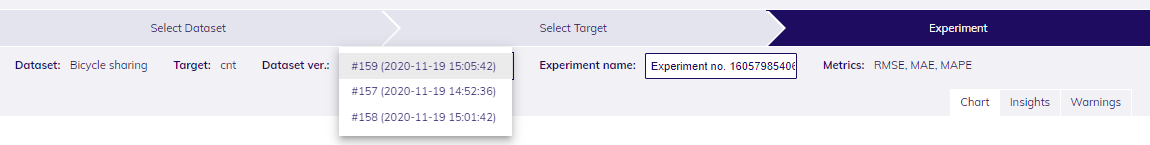
List of available versions
Iterations
When you are adjusting various settings such as mathematical transformations, or intervals etc. it will have impact on results, i.e. accuracy and values predicted. Let's say you'd like to compare what is an impact of adjusted settings and do not loos track of changes made. Because of this TIM Studio keeps track of all Experiment Iterations and can be reached via Iterations panel.
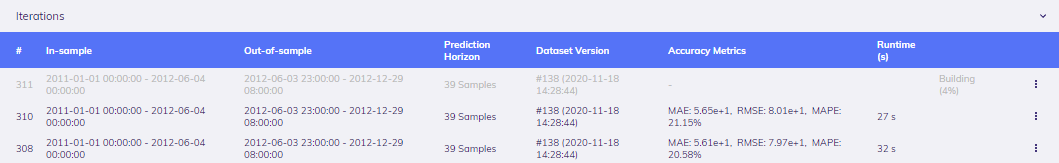
Iterations panel
Whenever button Build is submitted, new record in Iterations panel is created, and you can monitor progress of building. Once finished, all results from TIM Engine, such as values predicted, warnings, model details etc. can be explored.
To inspect details of finished Iteration just click on the one of your interest in Iteration panel, all content in Settings panel, chart etc. gets updated with details relevant for particular Iteration.
It is not possible to change anything in finished Iteration, however, it is possible to "clone" it. Select iteration of your interest in Iterations panel, adjust settings as needed, and click on Build button.
Iteration can be activated as Production setup which will mature your Experiment to Production use. There can be only one such Iteration per Experiment.
It is also possible to remove Iteration, click on "Delete" item in context menu for particular Iteration. Please be aware that if Iteration was activated as Production setup, or there are forecasts calculated with Production setup based on this particular Iteration, it cannot be deleted.
Downloading results
To download results, click on Download button below chart, or from context menu for respective Iteration. Values will be downloaded as CSV file.
Evaluating results
Read more about how to evaluate results.