Experiment Design
There are many domain-specific problems where time-series anomaly detection brings value and insight into the data. Some of them are more straightforward and easier to solve than others. Executives of a retail sales company want to be alerted if there is a sudden drop in the sales of a product or a car rental company desires to monitor the number of rented cars; these types of problems require to analyze one KPI with possible influencers that affect the KPI. On the other hand, there are industries where vast amounts of data are produced by different kinds of sensors like temperature, humidity, rotation speed etc. Such data usually describe the “health” of one or more machines or systems. Instead of one metric/KPI being monitored, such problems require monitoring the system as a whole.
Evaluating each metric separately is unfeasible if the data is cross-correlated, which is often the case. Such methods don't account for the correlations, resulting in many false positives/negatives.
Another possibility is to approach these problems with multivariate time-series anomaly detection. Such methods treat the data as one bulk; they try to identify the normal behavior based on the data interdependencies and produce a model that should be capable of recognizing anomalous behavior. If we take into consideration that there are hundreds or thousands of different measurements, this can be a challenging task. These methods suffer from the “curse of dimensionality” phenomena: as the dimensionality increases, it becomes more and more difficult to identify the true relationships among the metrics, which is crucial for building a reasonable normal behavior model.
TIM Detect's approach to complex machinery problems
The experts at Tangent Works feel that to tackle these problems, some supervision is necessary. TIM Detect proposes an approach where an anomaly detection problem is divided into several subproblems. Each subproblem represents some part of the whole system and is defined by one KPI metric and possible influencers affecting it. Specifying the subproblems requires knowledge of the underlying process. The group of metrics of a subproblem should closely relate to eachother with causal or correlational effects. On the other hand, correlation of some metrics does not necessarily mean that the relationship is important for the evaluation of a record as anomalous or normal. Therefore, having a deeper understanding of the problem is crucial.
A simplified schema of a system or machine with identified subproblems is represented in the figure below.
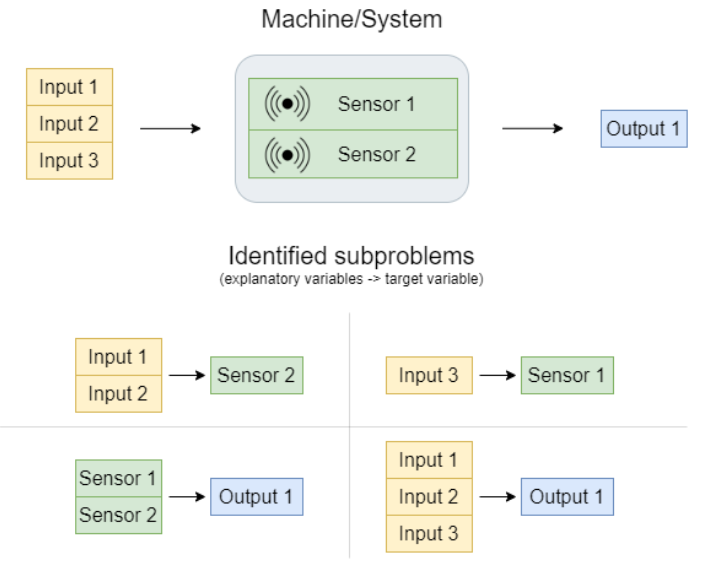
This example could be generalized with an arbitrary number of metrics/variables. Each of the subproblems is a separate anomaly detection task for the TIM Detect engine. The proposed approach has the additional advantage of locating a potential problem in the system more accurately, which would be much more difficult to accomplish using a classic system-driven approach and the results would be rather unreliable.