Time-series Anomaly Detection
Anomaly detection refers to the problem of finding patterns in data that do not conform to the expected behavior of a given group, i.e. it finds data points that do not fit well with the rest of the data (often referred to as anomalies, outliers, exceptions or contaminants).
Although traditional multidimensional outlier detection is applicable in many domains, an increasing number of areas generate time-series data such as sensor data, medical data, network intrusion data or financial data. Such data brings further complexity and challenges, making the analysis more demanding.
In this section, we will discuss the critical aspects and principal challenges of time series anomaly detection.
Critical aspects
time series are dependency-oriented data. In such data, anomalies are usually defined in a contextual or collective sense and are harder to distinguish from noise.
Furthermore, the assumption of temporal continuity plays a critical role in identifying outliers in time-series data. Temporal continuity refers to the fact that the patterns in the data are not expected to change abruptly unless there are abnormal processes at work.
Types of anomalies
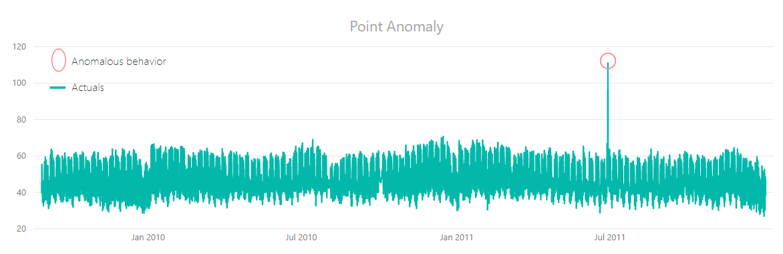
Point/Global
An observation that is far outside of the overall outlook of a given dataset (also called global outlier). This is the simplest type of anomaly and most of the research on anomaly detection focuses on it.
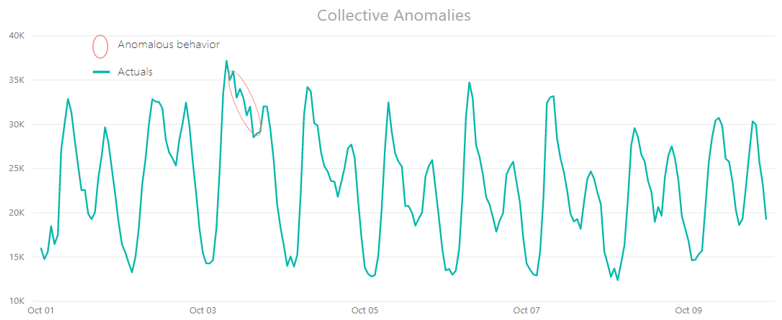
Collective
If a subset of related data points deviates significantly concerning the entire data set, it is called a collective anomaly. The individual data points in a collective anomaly are not anomalies by themselves in either a contextual or global sense, but their occurrence together (as a group) is abnormal. Such anomalies can occur only if data points are related, as in the case of time-series data.
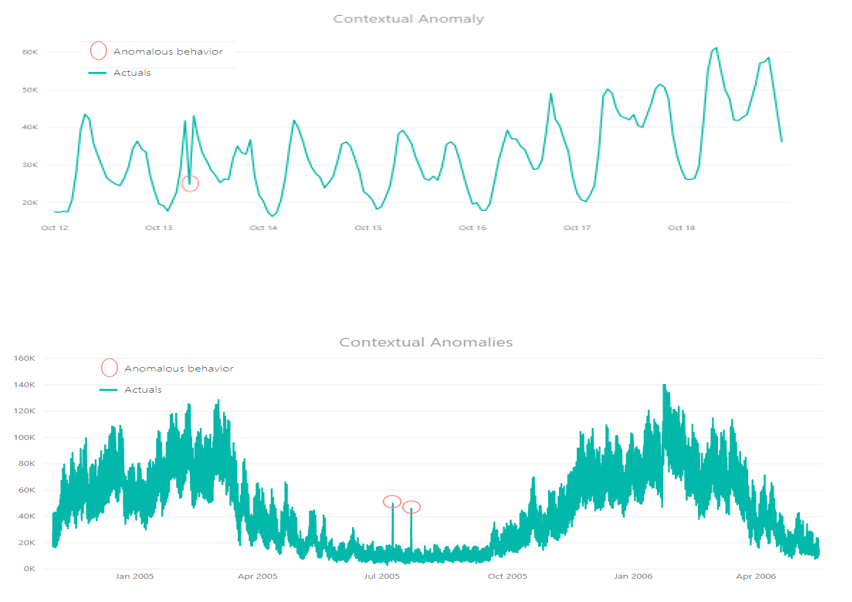
Contextual
It occurs when one or more data points are anomalous regarding the context, meaning its value markedly departs from the rest of the data points in the same context.
Principal challenges
Most of the challenges in time series anomaly detection arise from the critical aspects mentioned above.
An anomaly is defined as a unique point that does not conform to the expected pattern based on data known from history. Thus, data patterns have to be characterized by a normal behavior model, since anomalies are declared based on deviations from expected (normal behavior) values.
For having a robust automatic time series anomaly detection, to account for critical aspects of time-series data is of vital importance:
- Vertical analysis - correlations across time
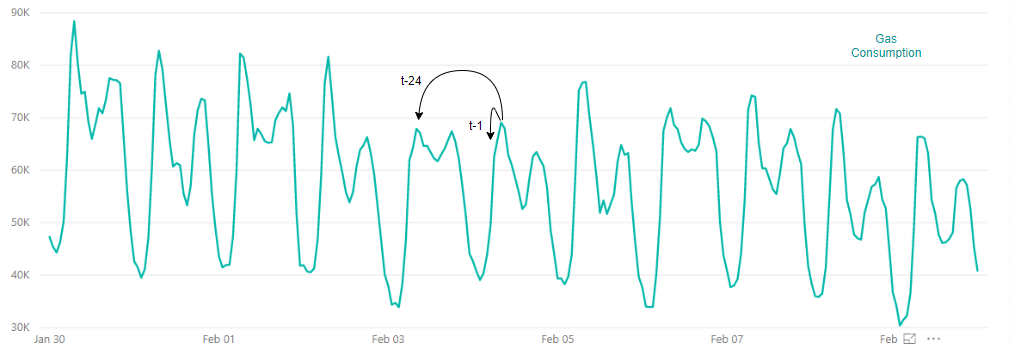
Temporal continuity plays an important role since it is assumed that time-series data values are highly correlated over successive instants. In multidimensional data where points are independent of one another, temporal continuity is much weaker.
For example, in a time series derived from sensor data, two successive data values are almost identical. Another example can be the gas consumption time series. Gas consumption at a time “t” has a significant autocorrelation with gas consumption at time “t - 1 hour” and gas consumption at time "t – 24 hours". On the other hand, individual car measurements (multidimensional data point) may be quite different from their preceding car measurements.
- Horizontal analysis - correlations across series
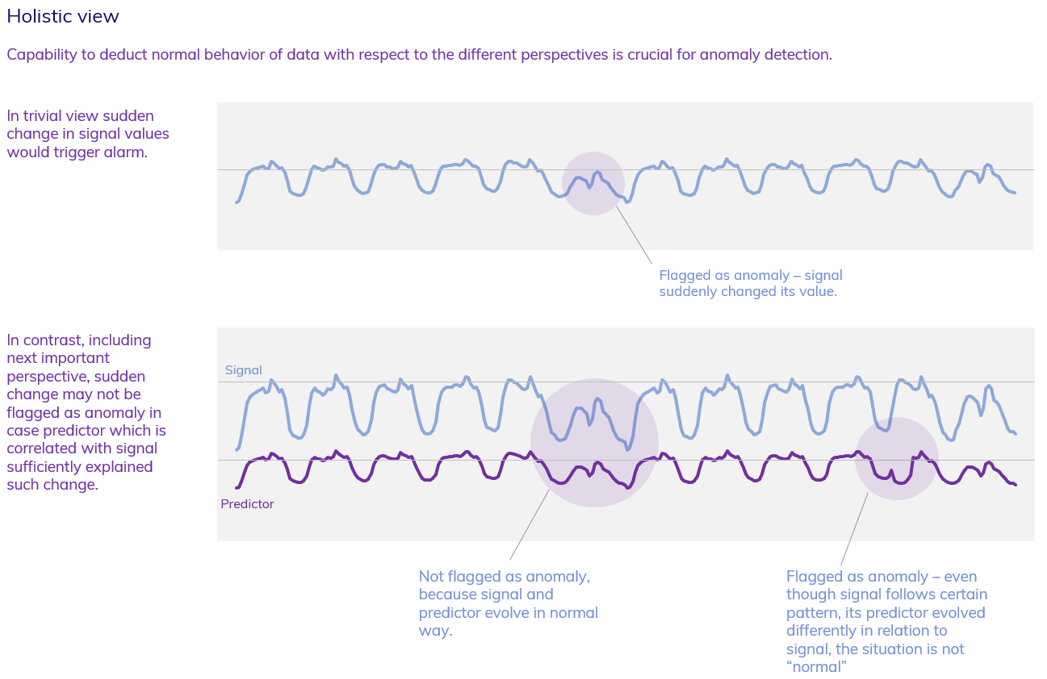
Many sensor applications, for instance, in complex machinery like a wind turbine, resulting in time series that are often closely correlated with one another. For example, the rotor speed of a wind turbine is dependent on wind speed. In such a case, a shallow view on one series is not enough; instead, both series should be taken into consideration when building a normal behavior model. An anomaly detection algorithm can deal with contextual anomalies only if it can judge the problem from all the important perspectives – we call it a holistic view.
- Time of detection
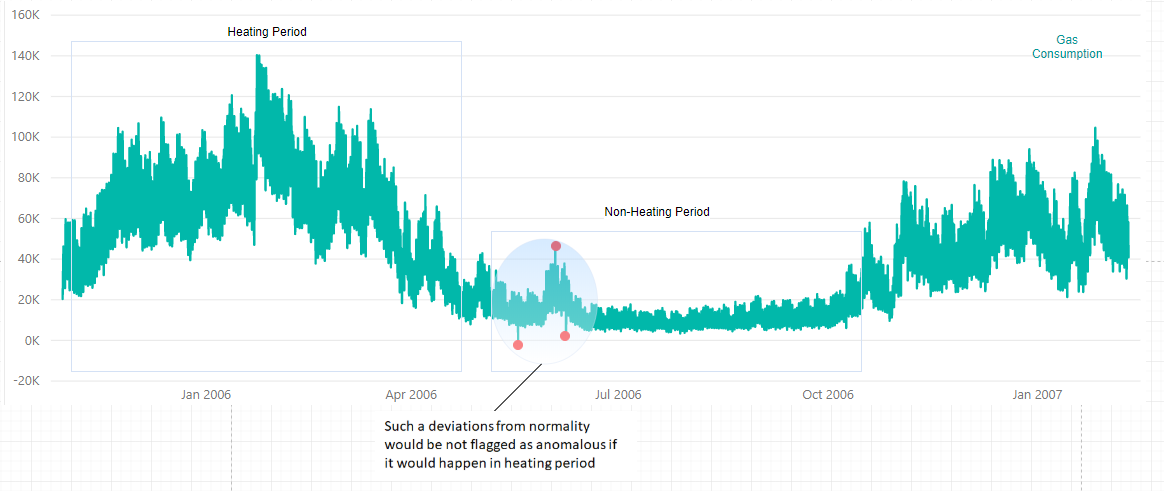
For some problems, the context of time is also an important part of reasonable anomaly detection. For instance, the normal behavior of a signal can be different through day and night, or it can have a weekly pattern. Furthermore, the same deviation from normality can be interpreted as anomalous for some hour/day/month/season but not for another. In the example below, we can see gas consumption time series throughout the year. There is a different dynamic in winter when comparing to summer. The same deviation from normal behavior can be considered anomalous during summer while it is normal during winter.
- Feature engineering
This is linked to the points mentioned above. In general, it is a difficult task to determine whether a point is anomalous or not. That is because it is not possible to create a reasonable normal behavior model without knowing what really affects a given time series. You need to get rid of variables that do not explain/relate to your time series. Very often, the value of the time series has non-linear dependencies or depends on lagged variables, autoregressive factors, time, etc. Therefore, it is crucial to incorporate such additional features in the normal behavior model, otherwise, you end up with many false positives/negatives.
- Unsupervised anomaly detection
Usually, there is no label in the data that would distinguish between normal and anomalous points. This fact causes two main challenges: overfitting and setting the correct contamination ratio (we call it sensitivity).
Without labels, a model is also trained on anomalous points; hence it has to be very robust; otherwise, it might be significantly affected by the anomalous points. The more anomalies are present in the model building period; the harder is to cope with the problem.
Since the contamination ratio is unknown, it is difficult to choose a correct border/threshold. Incorrect threshold settings can result in either many false positives (model is too sensitive to detect anomaly) or many false negatives (model is not sensitive enough to detect anomaly).
- Different perspectives
If the previous challenges are met, the deviance from the normal behavior can be a good indicator of the extent of how a given point is anomalous. However, treating deviances one by one is not sufficient for detecting collective anomalies. Instead, it is required to take a look from perspectives that treat the deviances collectively (see detection perspectives to learn more).
Supervision
Although TIM is designed to cope with all the above-mentioned critical aspects and challenges in an automated way, humans are always in the loop. Domain and systems knowledge is often vital. Only humans have the context required for automation. Thus, supervision is an important part, especially in the early stages of designing the experiment. Supervision may be helpful in distinguishing between noise and application-specific anomalies. Domain knowledge is also essential, especially for anomaly detection in complex machinery (for example, wind turbine), when for creating a reasonable detection system splitting the problem to subproblems and determining components/KPI is necessary. To learn more about designing the experiment see the design of experiment section.