Sensitivity
An important setting in anomaly detection is the sensitivity to anomalies. It goes hand in hand with the anomaly indicator, which conveys the information about the extent to which a given observation is anomalous. Sensitivity comes into play to define the decision boundary, allowing the model to distinguish between anomalies and normal points. The real-world examples show that this decision is often ambiguous and depends on the use case, user, business risk profile...
Sensitivity is defined as the percentage of the (model building/training/in-sample) data that is expected to be anomalous. It indicates how often an anomaly alert is triggered in the model building data. For example, a sensitivity of 3% considers the 3% most anomalous observations in the model building data to be anomalous; the user would have been alerted in this 3% of the data.
It is recommended to choose model building data with as few anomalies as possible and with a sufficient length (spanning a sufficiently long time period), to allow TIM to find the best possible model. In the case of labeled data, this can be accomplished by omitting anomalous observations from the model building data and setting the sensitivity to 0%. In this case, the model is not affected by anomalous points at all. Usually however, it is not known upfront which points are anomalous. In general, the percentage of anomalies should not exceed 5%; If it does, supervised learning could be a more appropriate approach than unsupervised anomaly detection.
Consider the following simplified example to better understand the link between data, sensitivity, anomaly indicator, and threshold.
The example starts with the following variable; the model building period is indicated in the image below.
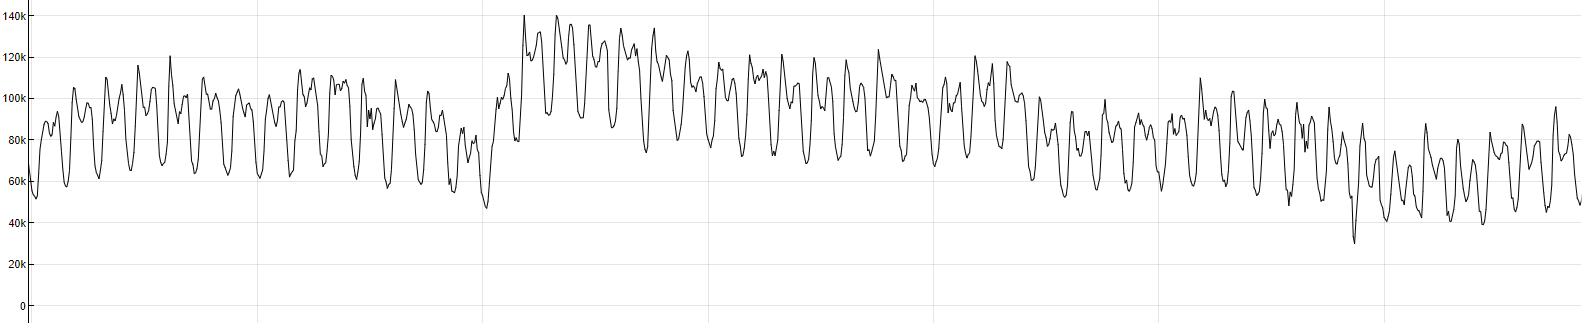
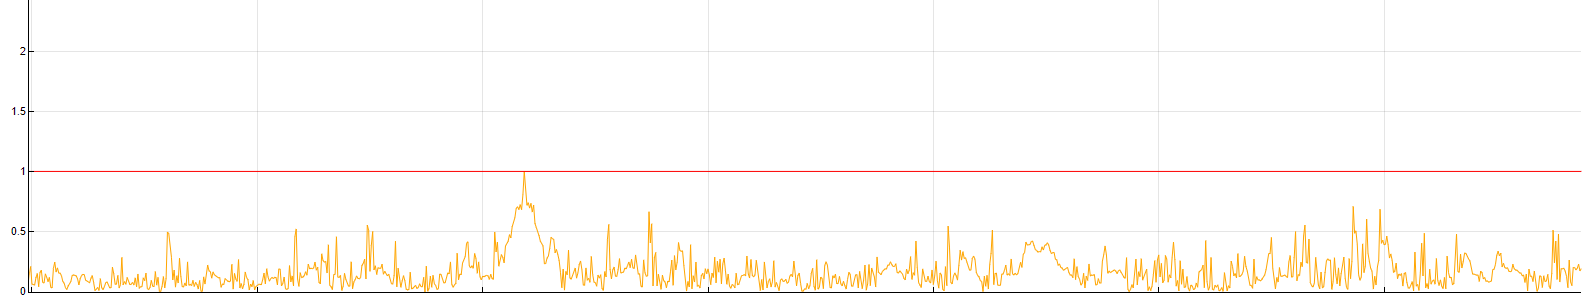
Running anomaly detection model building on this variable with the sensitivity parameter set to 0% results in an anomaly indicator that is below the threshold on the entire building period, as expected.
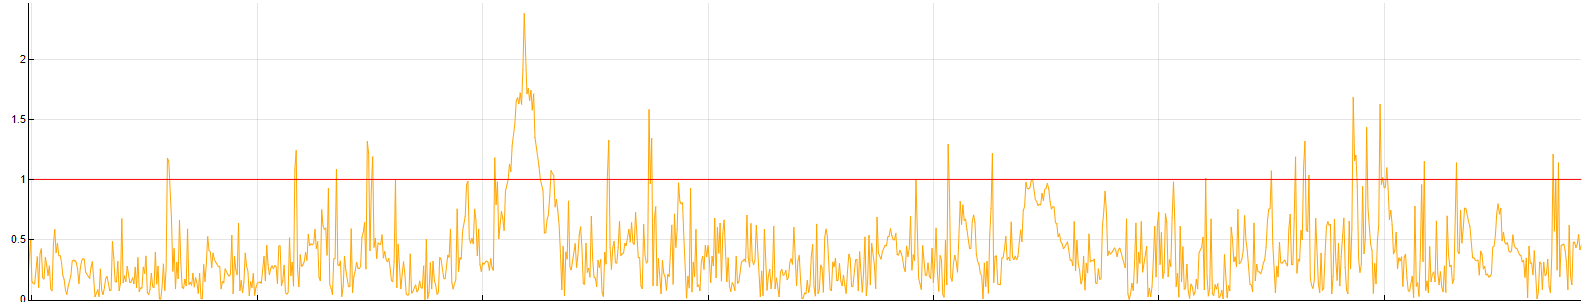
Running anomaly detection model building with a sensitivity of 5% causes the anomaly indicator to exceed the threshold on exactly 5% of the model building observations. Note that by changing the sensitivity, the threshold remains the same (equal to 1) but the anomaly indicator rescales.
So setting the sensitivity parameter estimates what percentage of the data is expected to be anomalous over the model building period. That means the higher the sensitivity, the more anomalies there will be on the out-of-sample period too (or when using the model in production). However, it does not mean that the percentage of anomalies on the out-of-sample period is guaranteed to be similar to the percentage of anomalies on the in-sample period.
Automatic sensitivity estimation
By default, the sensitivity parameter is estimated automatically.
Two major reasons for automatizing the sensitivities are:
- increase large scale potential
- in most of the cases, the number of anomalies is unknown
As explained above, sensitivity is a significant parameter in the anomaly detection process and has to be adjusted correctly as it affects how many anomalies are found. Finding the proper sensitivity can be tedious work in data that is unlabeled, which is often the case.
If a user prefers to be more conservative (be alerted less often, only in the most anomalous cases; false positives cost significantly more than false negatives), or on the contrary if the user's domain requires them to be alerted more often (false negatives cost significantly more than false positives), it is possible to manually set the sensitivity to a lower/higher percentage.