Forecasting Screen
The forecasting screen
The forecasting screen is a part of a forecasting workspace. The image below displays an exemplary forecasting screen.
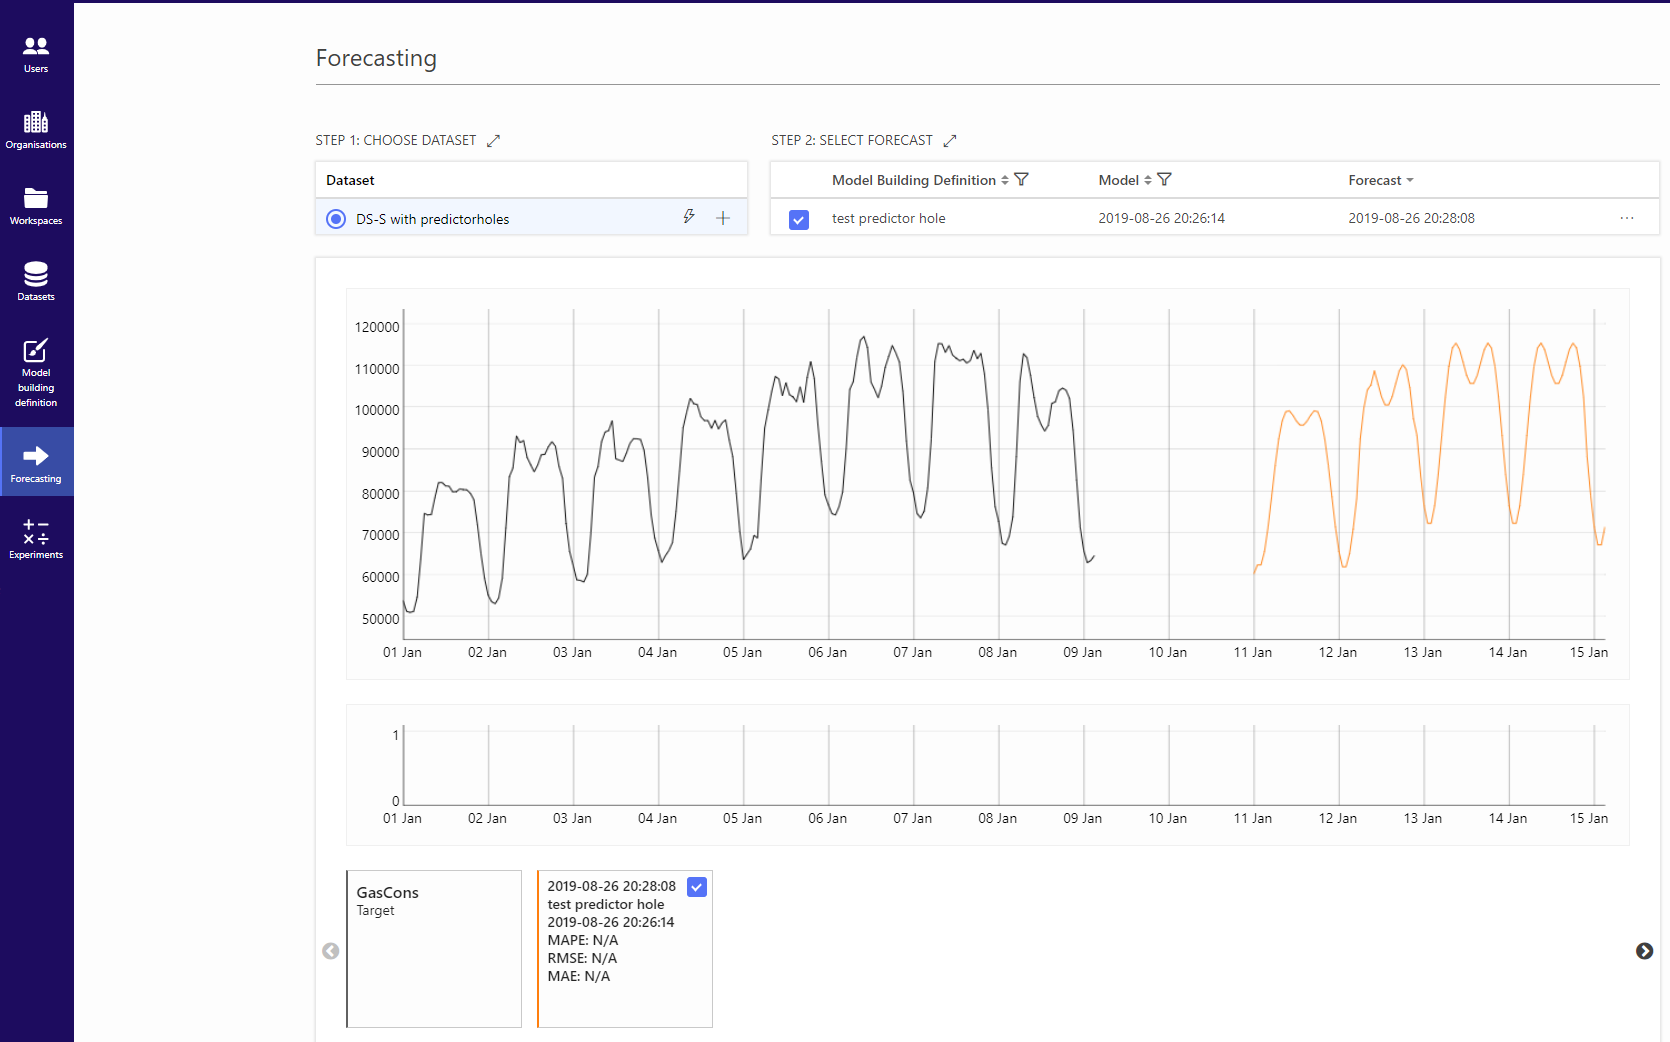
A user can create new predictions and inspect them visually on this screen. A forecasting screen consists of three main components:
- a list of the available datasets in the workspace,
- a list of the available forecasts in the workspace, which displays the results from models that are already built for a particular dataset and
- a chart area, which contains visualisations of selected forecasts and/or datasets.
Initially, the list of datasets and the list of forecasts are collapsed (and a user can see only one item). These lists can be expanded by clicking on the "Expand"-icon (![]() ).
).
Actions in the forecasting screen
The possible user actions in a forecasting screen are detailed below.
Creating a forecast
A user can get a forecast in two distinct ways:
- by using a model building definition and the model created based on it to forecast, or
- by using TIM's RTInstantML (Real Time Instant Machine Learning) technology, which will not rely on any previously created model, but will instead directly generate a forecast from the data. Both options are discussed in more detail below.
Forecasting with an existing model
This option is available as soon as there is at least one model building definition (MBD) and one model for the given dataset. The user can create a forecast by clicking on the plus-icon (![]() ) next to the dataset. When the user does this, the window below appears.
) next to the dataset. When the user does this, the window below appears.

Then, the user has to go through the following steps:
- Select a model building definition from the drop-down menu.
- Choose a model for this model building definition.
- Specify the date from which to forecast along with the number of forecasting steps. In case the user omits this setting, a forecast will be issued from the current datetime instance (i.e. from the current moment).
- Click the “Create forecast”-button. The new forecast is added to the list of forecasts and the calculation of the necessary values is initiated. The progress of this calculation is displayed in green, along with the percentage of the process that is already completed and the text “Forecast is being generated”.
Forecasting with RTInstantML
If a user needs to quickly predict the N next steps from an uploaded dataset ad-hoc, i.e. if usage date/time would not reflect the exact situation defined in the usage section of any model building definition, then forecasting with RTInstantML is the right option. In order to do this, the user has to go through the following steps:
- Click the “flash”-icon (
 ). This opens a dialogue window, as shown below, in which the end of the forecasting horizon needs to be entered by specifying the correct values for Forecast To (the unit) and Offset.
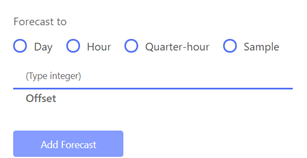
If the user for example selects "Day" and provides the value "2" in the Offset field, all forecasts until the end of the day after tomorrow will be calculated.
- Click the “Add Forecast”-button to add the new forecast to the list of forecasts and initiate the calculation of the requested values. The progress of this calculation is displayed in green, along with the percentage of the process that is already completed and the text “Forecast is being generated”.
Plotting forecast values
To display forecast values in a chart, the user needs to select the forecast to display by clicking the checkbox next to it. This looks as shown in the image below.

Comparing multiple forecasts visually
To compare two or more forecasts visually, the user needs to select the relevant forecasts by clicking the appropriate checkboxes next to them. When the user does so, the chart area below is automatically updated and the appropriate lines are added to the line chart.