Detection Screen
The detection screen
The anomaly detection screen is a part of a an anomaly detection workspace. The image below displays an exemplary detection screen.
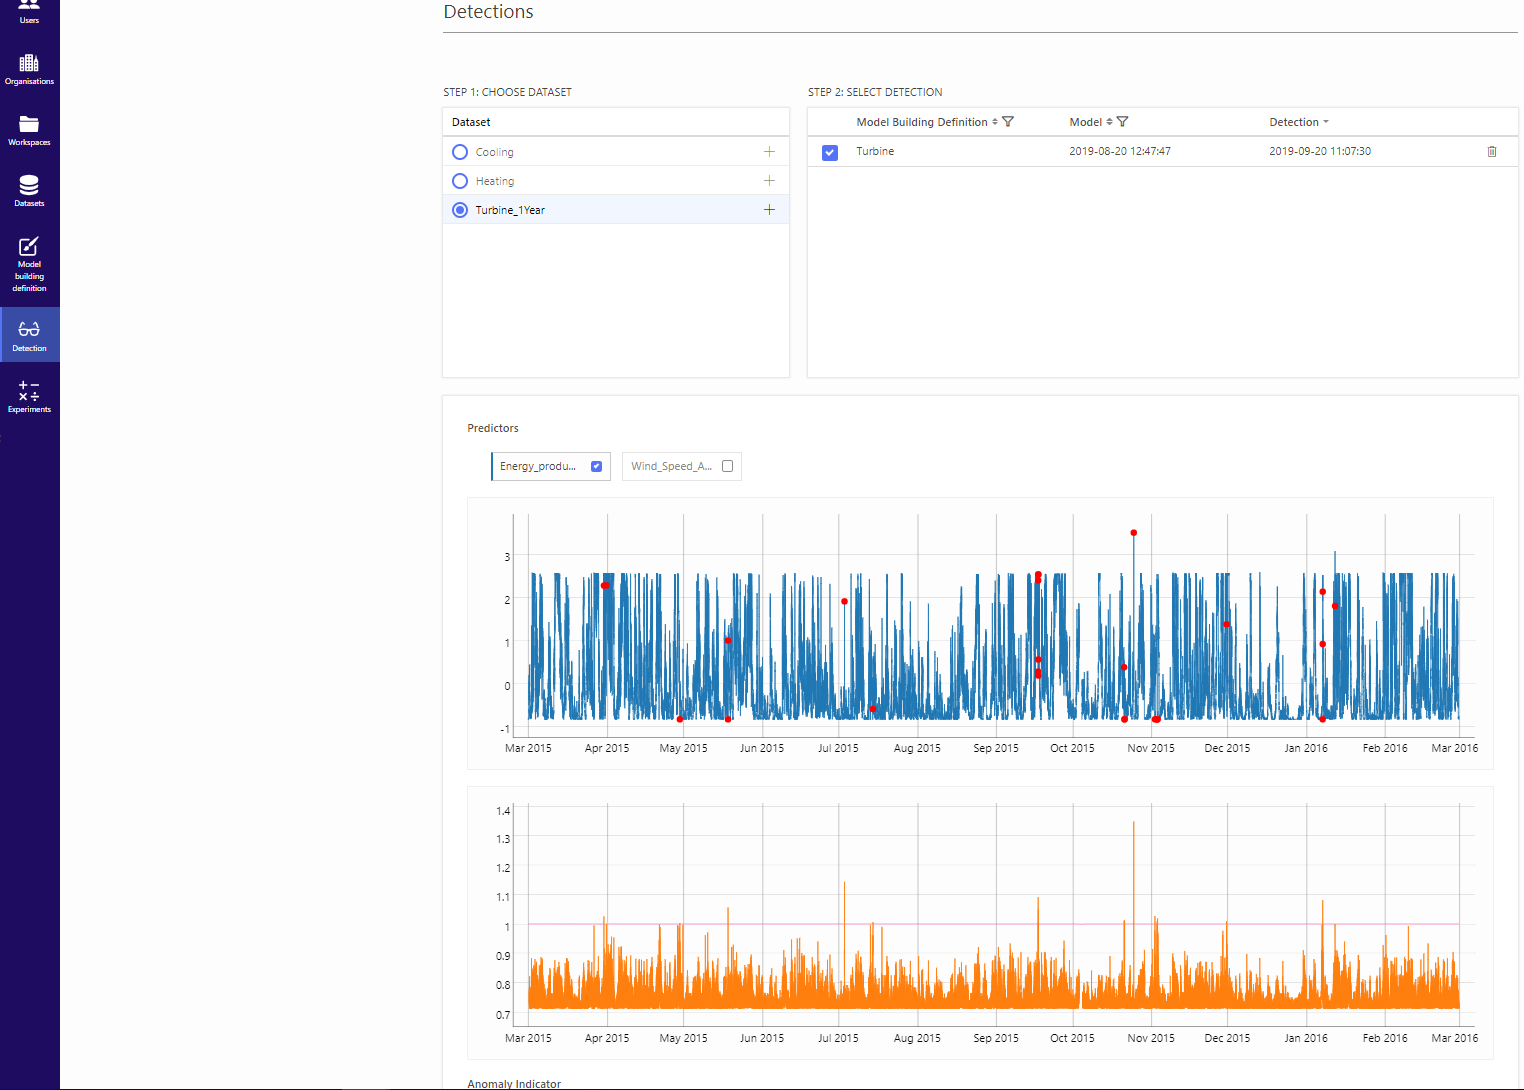
A user can create new anomaly detections and inspect them visually on this screen. A detection screen consists of 3 main components:
- a list of the available datasets in the workspace,
- a list of the available detections in the workspace, which displays the results from models that are already built for a particular dataset and
- a chart area, which contains visualisations of the selected detections and/or datasets.
Initially, the list of datasets and the list of detections are collapsed (and a user can see only one item). These lists can be expanded by clicking on the "Expand"-icon (
 ).
).
Actions in the detection screen
Creating an anomaly detection
Getting an anomaly detection requires the existence of an underlying model. As soon as there is at least one model building definition (MBD) and one model for a given dataset, a user can create a detection on that dataset. To get an anomaly detection, the user has to go through the following steps:
- Click the “plus”-icon (
 ) next to the appropriate dataset in the list of datasets. After doing so, the dialogue window shown in the image below opens.
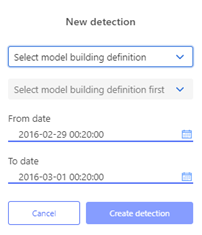
- In this dialogue window, choose the appropriate MBD and the appropriate model belonging to the selected MBD.
- Specify the period in which (a) detection(s) should be made by selecting the appropriate “from date” and “to date”. If the user does not select any dates, the default value is used. The default value is the last day in the dataset.
- Click the “Create detection”-button to create the detection. The user can also cancel the action by clicking the "Cancel"-button.
Deleting an existing detection
To delete an existing anomaly detection, a user has to go through the following steps:
- In the list of detections, click the "bin"-icon (
 ) of the detection that needs to be deleted. This icon is located under the last column.
 - Confirm by clicking the "Delete"-button.
Plotting detected values
To display (plot) a detection in a chart, a user needs to select the relevant forecast by clicking the checkbox next to it. Then, in the upper chart, the selected detections and the corresponding KPI's and influencers of the last ten days since the beginning of the detection will be showed. The second graph will display the anomaly indicator of the selected detections.
Visually comparing multiple detections
To compare two or more detections visually, a user needs to select the relevant detections by clicking the relevant checkboxes in the list of detections. Then, the chart area below will be updated and the new lines will be added to the line chart.