Anomaly Indicator
Informatively detecting anomalies in data requires more than just distinguishing whether a particular observation is anomalous or not. An anomaly indicator is designed indicate how anomalous a particular observation is.
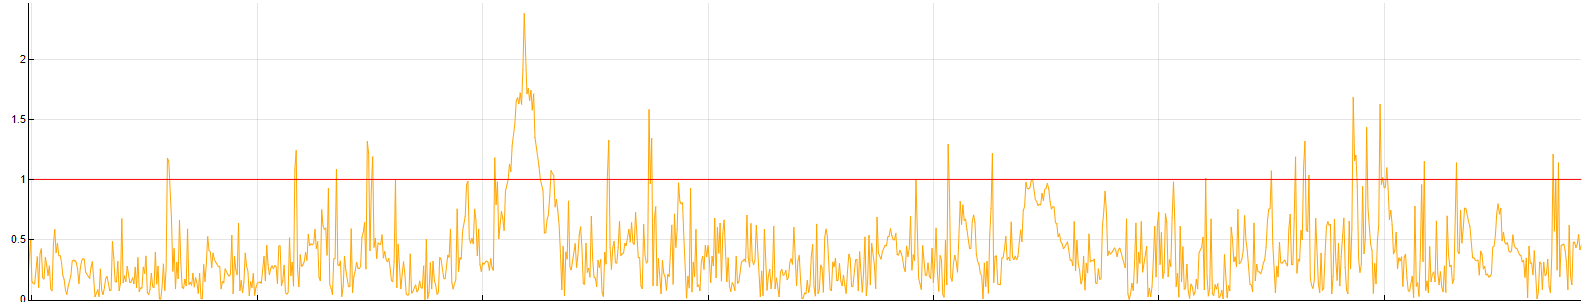
An anomaly indicator is a number in the interval (0, infinity) returned for each observation during model building, or for each observation in the detection period during detection (with the exception of a small number of data points at the beginning of each data range in case detection can't be done because of model offsets or the anomaly indicator window). The number 1 is the anomaly indicator threshold - if the indicator is below or equal to 1, the corresponding observation is considered normal; if it is above, it is considered an anomaly. The higher the number, the more anomalous that particular observation is.
An anomaly indicator is closely related to the sensitivity parameter. There is a direct relationship between an anomaly indicator and the sensitivity parameter.
Running the model building process with a sensitivity of 5% causes the anomaly indicator to exceed the threshold on exactly 5% of the model building observations. When changing the sensitivity, the threshold will remain the same (equal to 1), but the anomaly indicator will be rescaled.
When such a model is used for detecting anomalies on out-of-sample ranges, a higher sensitivity will generally result in the anomaly indicator exceeding the threshold more often, than a sensitivity closer to zero would.