What-If Analysis
What-if analysis allows people to analyze different scenarios by changing input variables and observing the model outputs. It can help in recognizing the impact of individual variables on the target variable and thus make the process more efficient or reveal critical situations.
A few examples from practice: in utility networks, the question may be asked what the consumption will be like tomorrow if the mean temperature is -10 degrees Celsius. When working with panel data in retail, the question might be asked what the sales would be if the store size were 100 square meters.
How it works
What-if analysis can be executed over forecast jobs that produce forecasts, not over those intended for analysis. That means over jobs of type build-model, rebuild-model, retrain-model, and predict, not over what-if or rca jobs. The parent-job is the job over which a what-if analysis is executed.
As input, variable name(s) and new values for specified timestamps must be provided. In the case of panel data, the group keys for each column must be given. The new input values are merged with the original data inside the engine, and a predict call is executed over the new values using a model related to the parent job.
The what-if analysis is calculated over out-of-sample and production timestamps from the parent job, and only the timestamps close to the modified timestamps that are possibly affected will be predicted - this is determined from the model using variableProperties and dataFrom.
This job's output is its result table, in the same form as that of its parent job. Accuracies are currently not returned.
Example
Electricity consumption
This example demonstrates a what-if analysis on electricity consumption data. The target variable is the electricity consumption, and temperature and public holiday are additional predictors. The sampling period is one hour. The model will be trained on the last two years; the last seven days will be used as out-of-sample period. The goal is to forecast for the day ahead, assuming that the temperature is known for that day.
First, a build-model job is executed and the resulting forecasts are obtained. Then, what-if analysis is performed with a modified temperature, increased by 10°F (5.56°C) for the last two days (the last out-of-sample day and the predicted day). The configuration used in this example is provided below.
[
  {
    "column": "Temperature",
    "data": {
      "2016-07-31 00:00:00":  81,
      "2016-07-31 01:00:00":  82,
      "2016-07-31 02:00:00":  83.67,
      ...
      "2016-08-01 21:00:00":  85,
      "2016-08-01 22:00:00":  84,
      "2016-08-01 23:00:00":  82
    }
  }
]
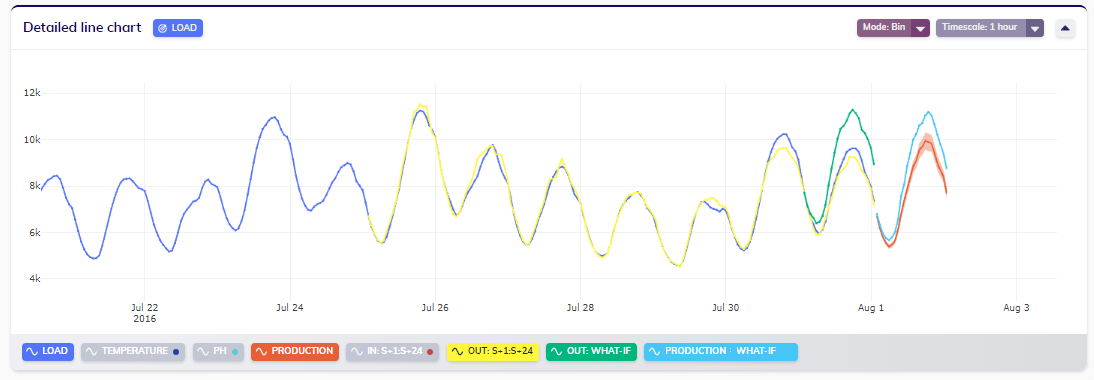
In the figure below, the different results are visualized, including the original target (blue line), the out-of-sample forecast (yellow line), the production forecast (red line) and what-if forecasts for out-of-sample (green line) and production timestamps (light blue line). Observe that the forecast for the penultimate day has increased by up to 20%, and the forecast for the last day has increased by up to 13%.