Panel Data
Panel data includes observations for multiple entities across time, while classical time-series data contains only observations for one individual entity across time. An example of panel data may be the retail dataset which includes information about sales of individual products across different stores. Another example may be a portfolio of solar farms across some regions. Individual entities may be created by different states, cities, stores, branches, departments, products, etc. We refer to the individual entities as groups and to the variables which split data into individual groups as group keys.
Dataset format
Properties of the panel data are describe in the input data properties section.
Example
The following dataset is an example of panel data from retail. It contains information about daily sales across different categories of products and different stores. The target variable is the Sales, and the group keys are Store ID and Category. There are Holidays and Store Size as additional predictors. Store Size is a time-invariant variable, while Holiday is a group-invariant variable.
| Store ID | Category | Timestamp | Sales | Holidays | Store Size |
|---|---|---|---|---|---|
| 1 | Food | 2022-01-01 | 11 | 1 | 25 |
| 1 | Food | 2022-01-02 | 10 | 0 | 25 |
| 1 | Food | 2022-01-03 | 16 | 0 | 25 |
| 1 | Food | 2022-01-04 | 20 | 0 | 25 |
| 1 | Food | 2022-01-05 | 0 | 25 | |
| 1 | Household | 2022-01-01 | 20 | 1 | 25 |
| 1 | Household | 2022-01-02 | 22 | 0 | 25 |
| 1 | Household | 2022-01-03 | 35 | 0 | 25 |
| 1 | Household | 2022-01-04 | 42 | 0 | 25 |
| 1 | Household | 2022-01-05 | 0 | 25 | |
| 2 | Food | 2022-01-01 | 40 | 1 | 100 |
| 2 | Food | 2022-01-02 | 43 | 0 | 100 |
| 2 | Food | 2022-01-03 | 62 | 0 | 100 |
| 2 | Food | 2022-01-04 | 78 | 0 | 100 |
| 2 | Food | 2022-01-05 | 0 | 100 | |
| 2 | Household | 2022-01-01 | 81 | 1 | 100 |
| 2 | Household | 2022-01-02 | 86 | 0 | 100 |
| 2 | Household | 2022-01-03 | 135 | 0 | 100 |
| 2 | Household | 2022-01-04 | 160 | 0 | 100 |
| 2 | Household | 2022-01-05 | 0 | 100 |
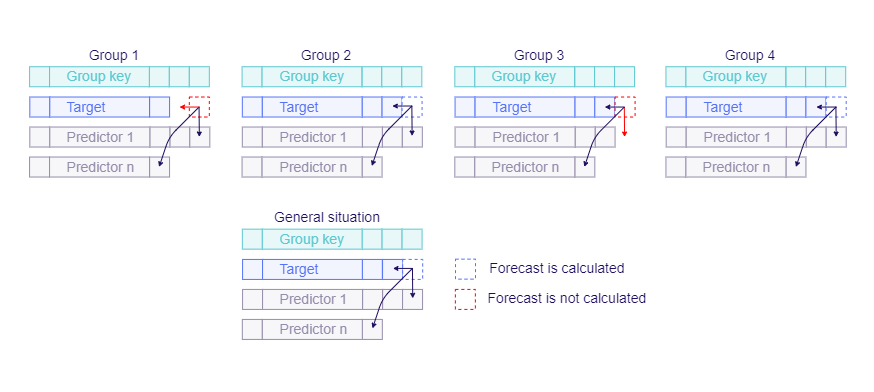
Data alignment and situation detection
Dataset does not have to be balanced (all entities have observations for the same time intervals); however, TIM assume that all situations are the same for each individual group. And only models for general situation will be trained and used for prediction. General situation is determined by looking at the whole dataset and each variable's last timestamps over the entire dataset. If the alignment of dataset endings are not identical across all groups, some situations for not aligned groups will be not trained and predicted.
In-sample and out-of-sample rows may be given relatively. In such case, the timestamps to be predicted are determined from the overall last target timestamp for each type of forecast. Overall last target timestamp is the maximal timestamp for which there exist a target value in some group.
Production forecasts are returned for timestamps determined from the prediction horizon and overall last target timestamp.
Applications
Portfolio modeling
When individual entities have common behavior it may be beneficial to train one model on all entities rather than train individual models. It enables to fit a more general model and captures effects that may be on one entity not significant, or the data for the entities may be shorter.
Sometimes accuracies at different levels of aggregations are interesting. In such cases, modeling of all entities together can provide more accurate results.
Zero history models
Some entities may have a short history or even no history. An example may be a new open store, new solar or wind farm or missing meter on the device. In such cases, the model may be trained on similar entities and then used for prediction. Usage of time-invariant variables may be beneficial. Time-invariant variable are for example size of a store (see example above) or total installed capacity of solar farm. These variables help to learn the correct scale of the individual group.
Use Cases
Check out some related use cases with the TIM python client: