TIM Forecasting Output
Forecasting output
A typical forecasting output might look like the following table:
| timestamp | date_from | time_from | target | forecast | forecast_type | relative_distance | model_index | samples_ahead | lower_bound | upper_bound | bin |
|---|---|---|---|---|---|---|---|---|---|---|---|
| 2014-10-28T03:00:00.0 | 2014-10-28 | 02:00:00.0 | 87218 | 86917 | 0 | D+0 | 1 | 1 | 83047 | 91416 | S+1:S+24 |
| 2014-10-28T04:00:00.0 | 2014-10-27 | 21:00:00.0 | 85922 | 84287 | 0 | D+1 | 7 | 7 | 76893 | 94645 | S+1:S+24 |
| 2014-10-28T04:00:00.0 | 2014-10-27 | 22:00:00.0 | 85943 | 84287 | 0 | D+1 | 6 | 6 | 77401 | 94602 | S+1:S+24 |
| 2014-10-28T04:00:00.0 | 2014-10-27 | 23:00:00.0 | 85912 | 84287 | 0 | D+1 | 5 | 5 | 77872 | 93733 | S+1:S+24 |
| 2014-10-28T04:00:00.0 | 2014-10-28 | 00:00:00.0 | 86668 | 84287 | 0 | D+0 | 4 | 4 | 79405 | 93945 | S+1:S+24 |
| 2014-10-28T04:00:00.0 | 2014-10-28 | 01:00:00.0 | 86947 | 84287 | 0 | D+0 | 3 | 3 | 80484 | 93424 | S+1:S+24 |
Noticably, this table contains multiple different forecast values for a single timestamp, indicating that different predictions were made for this point in time. The next section explains why this happens.
Multiple forecasts for a single timestamp
When TIM is deployed in production, it looks at the current situation and selects the most appropriate model from the Model Zoo. TIM then applies this model to calculate the desired forecast.
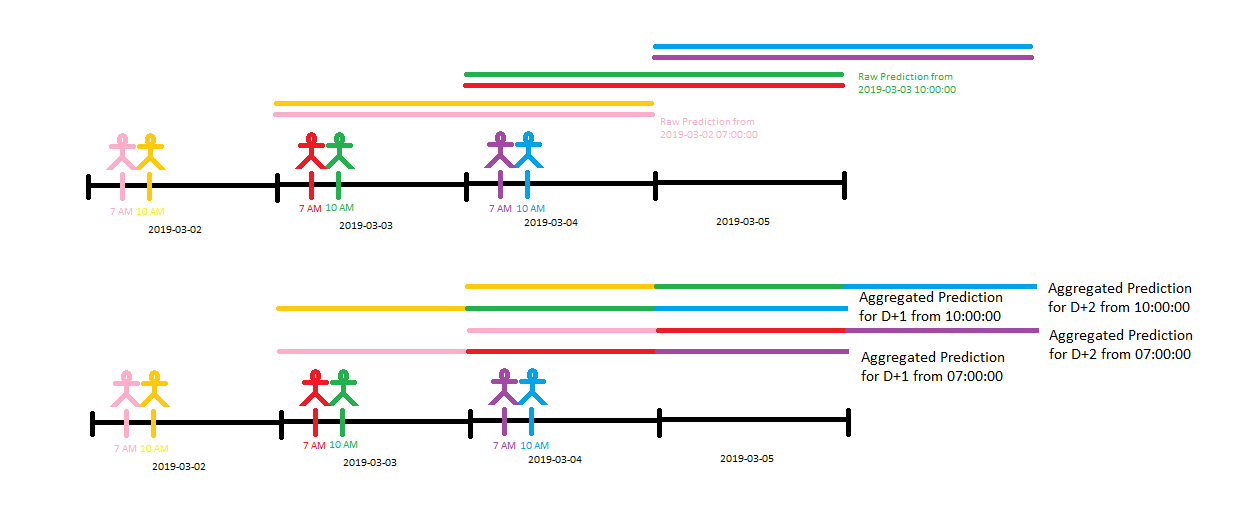
For example, consider a Model Zoo prepared to forecast at 07:00 and 10:00, for one day ahead and two days ahead. Suppose a user wants to make a forecast at "2019-03-02 07:05:35" for "2019-03-03 15:00:00". In that case, TIM will automatically recognize that the data availability corresponds to the 07:00 scenario and that the desired forecast corresponds to the one day ahead scenario.
TIM's ability to recognize the current situation is essential; the desired forecast could also have been made in other situations, for example using the data availability scenario at 10:00 the previous day with the two days ahead scenario. This would result in less accurate forecasts, as this mode would ignore the most recent available data. TIM's ability to recognize situations thus empowers TIM to seamlessly select the best possible model to ensure the best possible forecasts are made. When using TIM to regularly use deployed models to forecast, TIM can automate this tedious situation awareness and optimal model selection.
However, the situation gets more complicated when doing so-called backtesting. A user might be interested in a model's performance before deploying it in production. Therefore, models are often tested on historical data before they are deployed. Every historical timestamp could be "forecasted" from different perspectives because the data is available to support these different views. That is why each timestamp might have multiple forecasts in multiple qualities.
The information in the output table
- datetime: the timestamp of the record for which the forecast was made. In cases where a user wants forecasts for records that are not part of his forecasting routine (e.g. forecast for 3 PM with a model trained to do 1 sample ahead at midnight), the timestamp won't be listed.
- date from: a specific date from which the forecast would have been made (backtesting) or was made (production).
- time from: a specific time from which the forecast would have been made (backtesting) or was made (production).
- target: the actual value. If this information is not available to TIM, the value missing is used.
- forecast: the forecast for the given record.
- forecast type: the type of the forecast; there are 3 possible values. 0 indicates that the forecast was made for a record that was used for model building (in-sample backtest), 1 indicates that the forecast was made for a record that was not used for model building but is still a known historical value (out-of-sample backtest), and 2 indicates that the forecast belongs to the desired forecasting horizon (production forecast). This indicates whether this is the best forecast possible for the given timestamp, which can only be true for out-of-sample records (see below).
- relative distance: the relative distance of the record from the date and time it was forecast from. In cases where data is sampled with a sampling period from the interval <seconds, days>, this is expressed in days (e.g. D+7); in cases where it is not, this is expressed in samples (e.g. S+5).
- model index: the index of the model from the Model Zoo that was used to create the forecast.
- samples ahead: the distance of the forecast from the last available target sample, measured in samples. "Available" here means "could be used in the simulated/current forecasting situation".
- lower bound: the lower bound of the prediction interval for the given forecast.
- upper bound: the upper bound of the prediction interval for the given forecast.
- bin: serves to divide forecasts into continuously plottable signals.
Extracting information from the output table
To meaningfully measure accuracy or plot the output structure, many filters can be used. Plots can be created only for filters with no duplicate datetime values. In general, it is preferable to distinguish between "out-of-sample" and "in-sample" values. This section lists potential filters with their limits and strengths.
- All forecasts with forecast type Production: This option returns the forecasts and records that should be looked at when doing a real-time production forecast.
- All forecasts: This filter can not be plotted; however, it can give a good idea about how the model performs in general by averaging its accuracy fields.
- Forecasts for a specific bin: This is the easiest filter to plot a continuous signal with. It is concatenated from different raw forecasts (see below) and split to different parts of the forecasting horizon so that the signals do not overlap. Earlier bins (bins with lower samples ahead) cover as many samples as possible so that the signal is continuous.
- Forecasts for a specific amount of samples ahead: This filtr can be plotted. It provides a basic idea about how the accuracy deteriorates with rising forecasting horizon. It's a good filter to use for backtesting.
- Forecasts with a specific time from and relative distance: This filter can be plotted. It is especially useful in daily repeating scenarios where multiple days ahead are forecasted at once. It provides answers to questions like "What would my day-ahead accuracy be like if I forecast every day at 7AM?". It's a good filter to use for backtesting.
- Forecasts from a specific date from and time from: This filter can be plotted. It shows how one particular forecast in the past would have looked like. The image below shows what this means visually.
- Forecasts with a specific model index: This filter can be plotted. It gives insight into the model creation and why the forecast looks like it does.It's excellent for discovering the origins of inaccurate forecasts.