The Model Zoo
The job's result include its Model Zoo, which is visualized on the experiment page in TIM Studio.
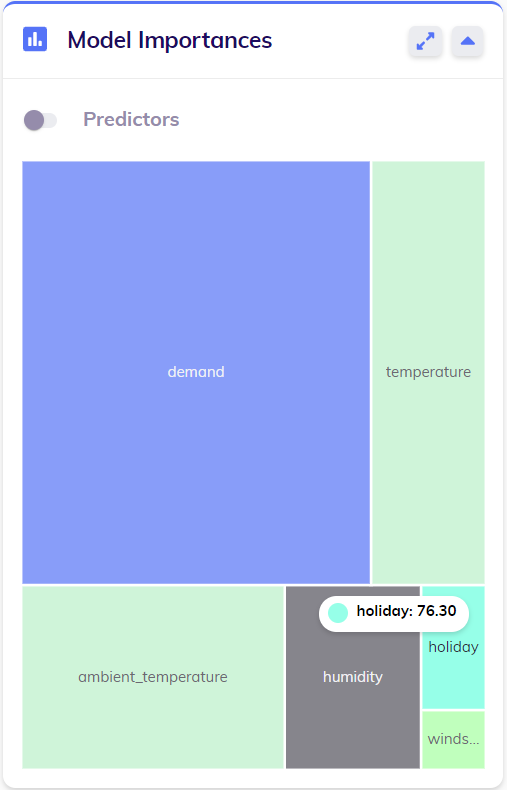
Predictor importances
By default, the predictor importances are shown, visualized in a treemap. This visualization represents the extent to which each predictor (each input variable) contribute to the models and thus the forecast or detection. The color scheme of the treemap matches the colors of the predictors in the line chart; hovering over the treemap will give the user more information about the relevant predictors and their importance.
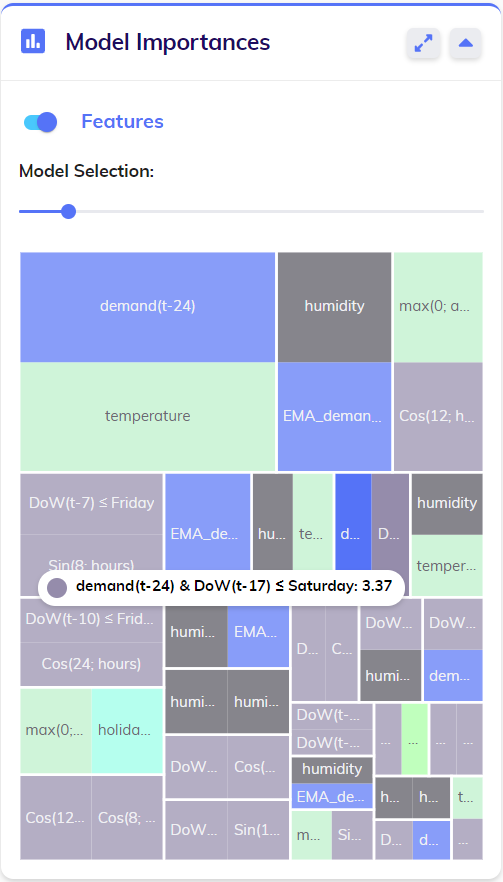
Feature importances
Flipping the switch above the treemap changes to that of the feature importances. This visualization represents the extent to which each feature (generated transformation of input variables and other data) contribute to the model and thus the forecast or detection. If applicable, a slider bar will appear allowing users to browse through the different models used in calculating the requested forecast or detection. Again, the color scheme of the treemap matches the colors of the predictors in the line chart; this time a single feature may have multiple colors, meaning it represents an interaction between multiple (input or artificial) variables. Again, hovering over one of the treemaps will give the user more information about the relevant features and their importance.
The Model Zoo browser
The expand icon ![]() at the top right corner of the treemap can be used to open up the Model Zoo browser. As the name suggests, this pop-up allows the user to inspect the entire Model Zoo and all information that is contained in it.
at the top right corner of the treemap can be used to open up the Model Zoo browser. As the name suggests, this pop-up allows the user to inspect the entire Model Zoo and all information that is contained in it.
The image below shows the overview of the Model Zoo in the Model Zoo browser. This overview is a larger version of the predictor importances described above.
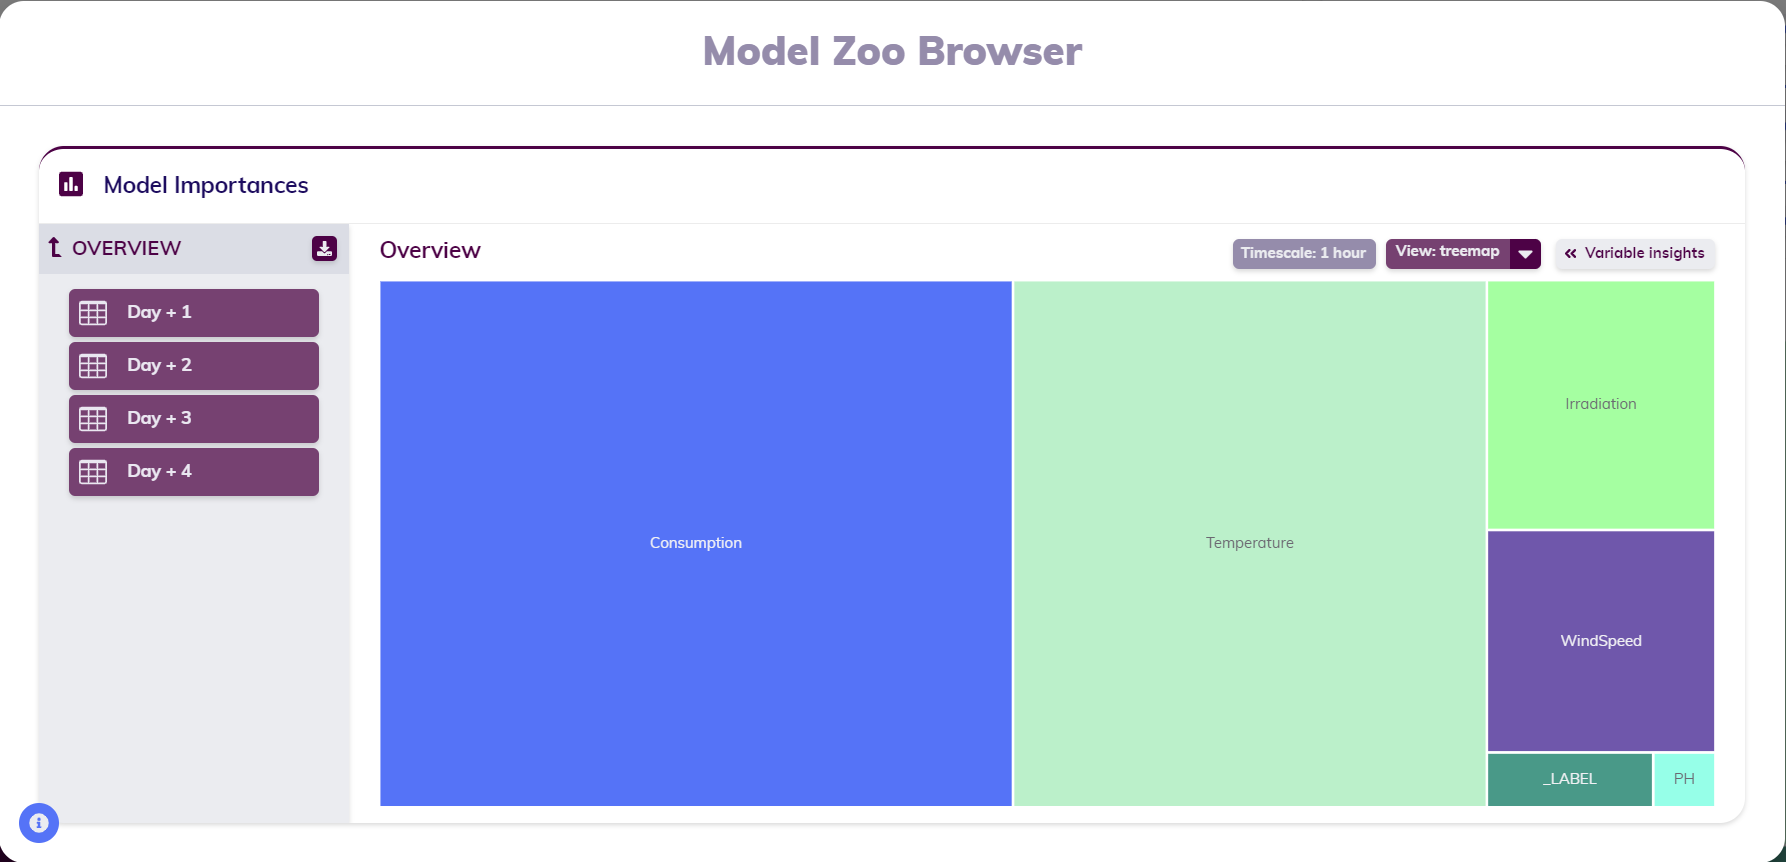
The Model Zoo browser contains much more information than just the importance of the predictors; spread over different parts of the Model Zoo Browser. The next sections discuss them one by one.
Model Zoo navigation
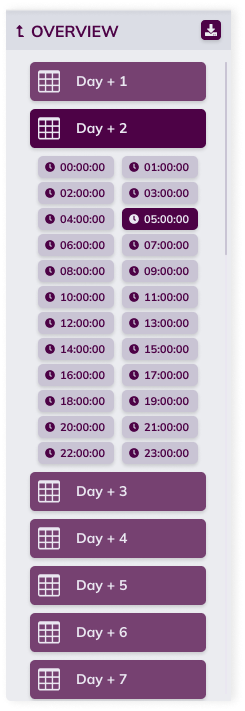
The leftmost part of the Model Zoo browser is a navigation section. This section allows the user to intuitively navigate through the Model Zoo to find the specific model of interest.
Clicking "OVERVIEW" serves to return to the overall predictor importances of all the models in the Model Zoo. At the top right part of this navigation section, the download button ![]() allows the user to download the entire Model Zoo in JSON format for further use, ex.g. uploading it to a TIM Edge installation.
allows the user to download the entire Model Zoo in JSON format for further use, ex.g. uploading it to a TIM Edge installation.
The rest of this section gives hierarchical overview of the model in the Model Zoo. The way this overview is structured in itself contains information about the Model Zoo: it's different for daily cycle and non-daily cycle Model Zoos.
For a non-daily cycle Model Zoo, the models are listed by their index, as shown in the image below.

For a daily cycle Model Zoo, there is yet another distinction between forecasting and anomaly detection Model Zoos. The models are listed by the hours they apply to. For forecasting Model Zoos, they are further divided over the number of 'days ahead' they are built to forecast to, as shown in the image below.
For anomaly detection Model Zoos, this 'days ahead' level isn't included as it doesn't make sense here: anomaly detection doesn't happen over a forecasting horizon. Therefore, there's only a single day's worth of models in a daily cycle anomaly detection Model Zoo, as shown in the image below.

Views
When one particular model in the Model Zoo is selected, that model's feature importances are visualized. The title above the chart indicates the model's index; in the image below the model's index is 15. At the top right corner of the card, a breadcrumb shows the path towards the current model in the Model Zoo; in the image below the model for 14:00:00 for Day + 1. Again, the overview button allows the user to return to the overall predictor importances of all the models in the Model Zoo.
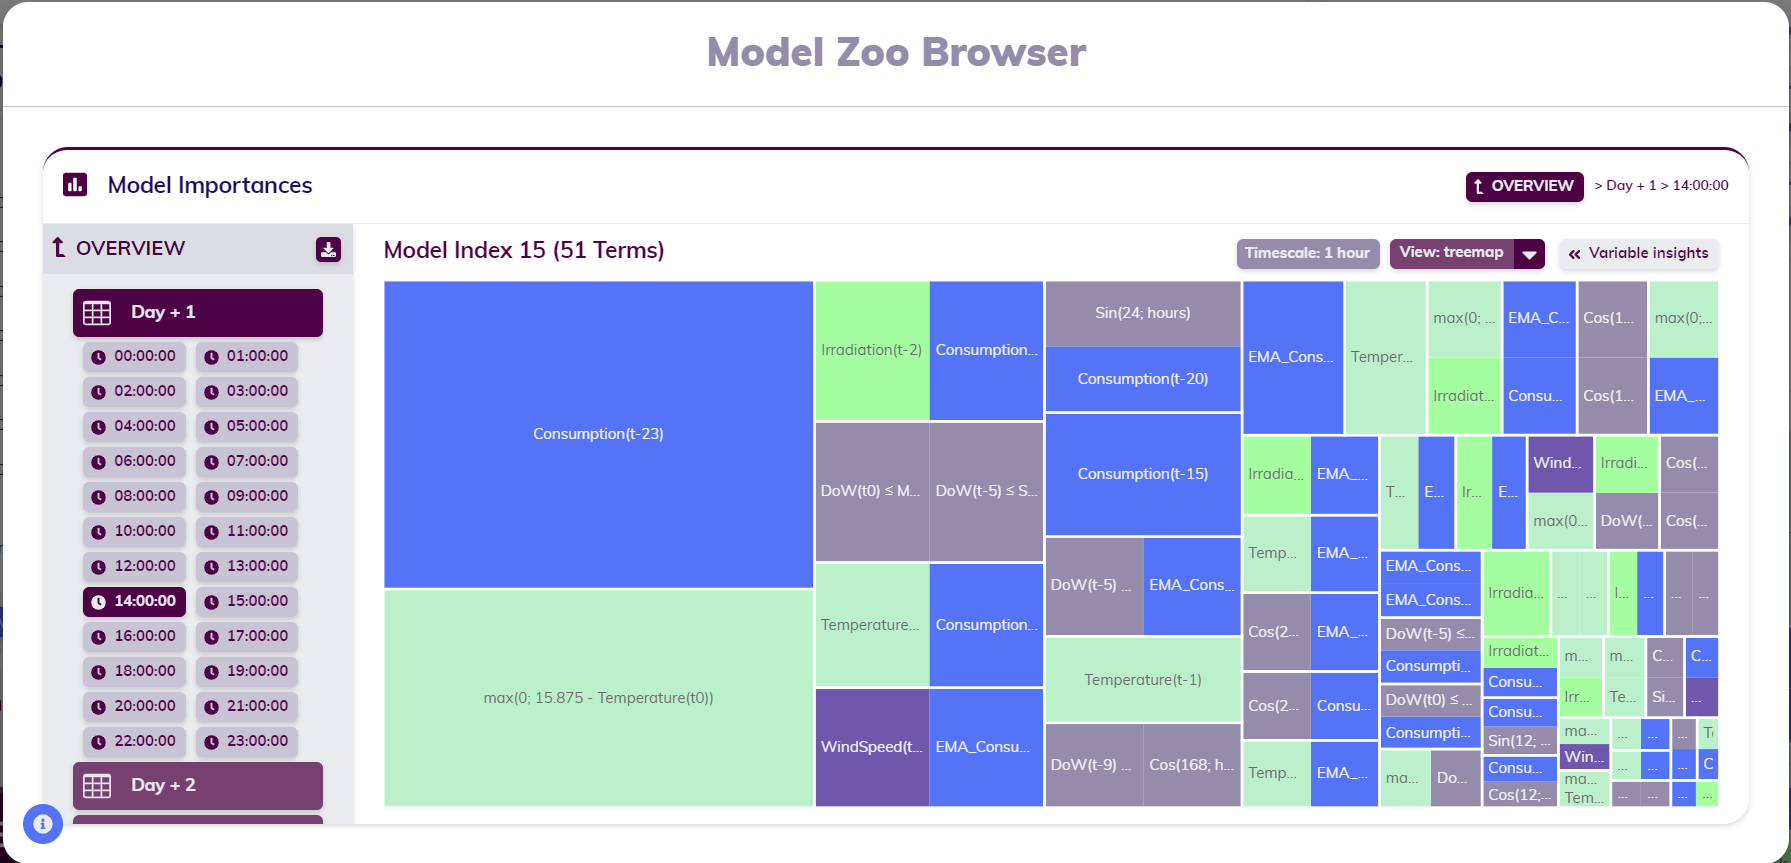
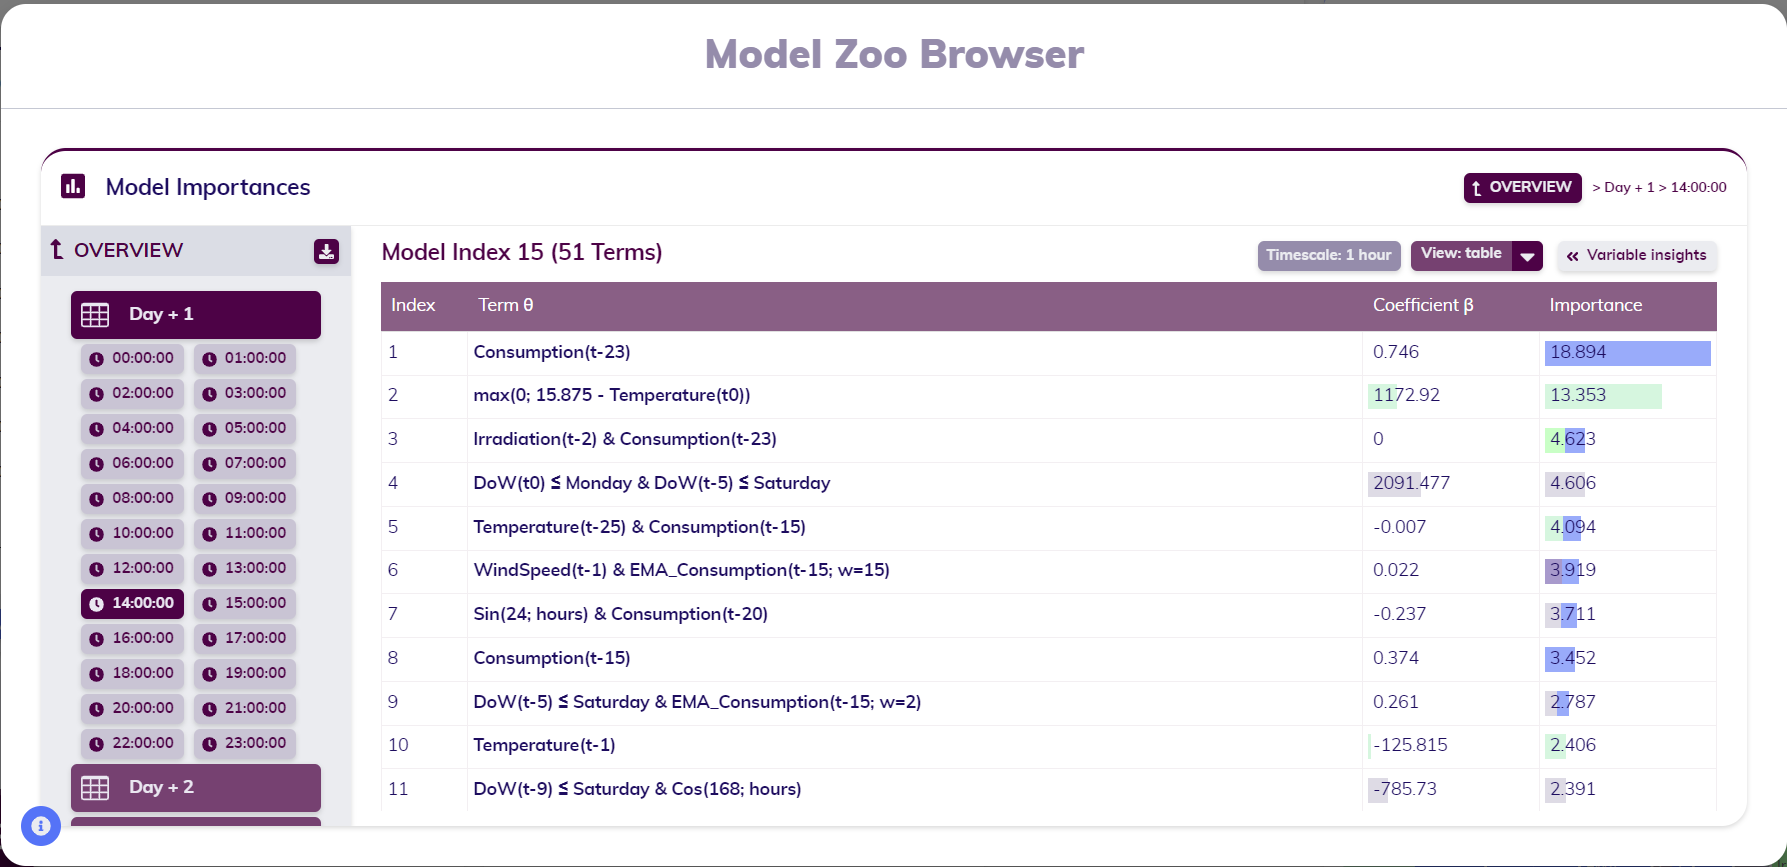
At the top right of the chart, the user can switch between views. Current supported views are the familiar treemap view - for clearly visualizing ratios and overall variable contribution - and a table view - for an organized view on the terms, their importance and their coefficients, and how importances and coefficients each compare. The image above shows a treemap; the image below shows the same model's table view.
Timescale
Next to the menu allowing users to switch view, the timescale of the dataset the Model Zoo was built on is displayed - in this case, this is one hour.
Insights
At the top right part of the chart zone (right below the breadcrumb if present), an insights button can be found. This button opens the insights tab, which contains additional insights into the different variables usage in the model in question and on the model itself. The information in this tab covers multiple topics: variable offsets, unused variables, and for forecasting models also the data difficulty (overview) and model complexity (model).
Variable offsets
The variable offsets section contains information about the offsets of the relevant variables. For each variable, the used offsets are shown on a time axis. On top of improving the insight into the model, the variable offsets used by a model gives the user knowledge of exactly what data should be included if they want to use the same model and apply it to new data (a new dataset version).
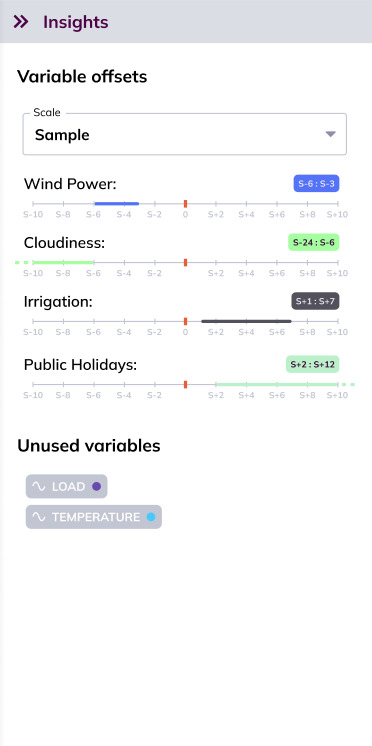
Both the scale and relative position to the anchor point of these axes are automatically selected for optimal viewing of the different variable offets; it is however possible for the user to change the scale if preferred.
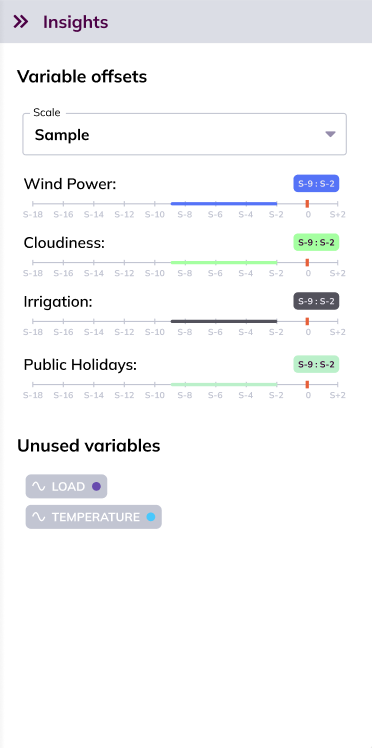
For forecasting models, the available offsets can be shown next to the used offsets by toggling them on in the Use available offsets switch. This visualizes the differences (if any) between the offsets that were available to the model during training, and the offsets that are actually used by the model.
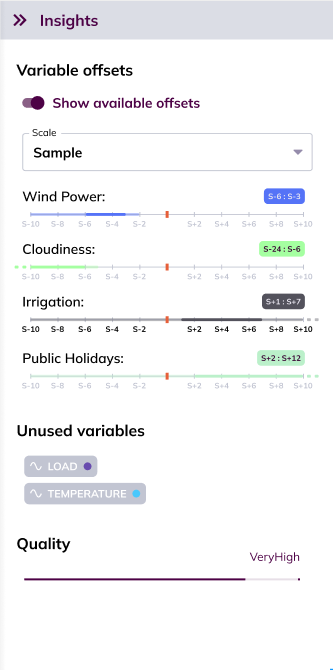
Unused variables
The unused variables section contains an overview of variables included in the dataset, but not used in this particular model. When on the overview of all the models in the Model Zoo (i.e. no model is selected), this section shows the variables that were not used throughout the entire Model Zoo. In the image below, the unused variables are Load and Temperature.
Data difficulty
For forecasting models, the data difficulty is displayed in the insights tab in the Model Zoo Browser Overview

Model quality
For each forecasting model, the model quality is also displayed in the insights tab of that model in the Model Zoo Browser.