detect
configuration parameter | default value |
|---|---|
automatic | |
manual |
Sensitivity
Sensitivity is a critical setting in Tangent’s anomaly detection that determines the percentage of data that you expect to be anomalies during the normal behavior modelling phase. By understanding and configuring sensitivity, you can tailor the model to meet your specific needs, whether you want to detect every potential anomaly or focus only on the most significant ones. It is also a way to deal with unexpected abnormal behaviour during the training phase.
High Sensitivity: Detects more anomalies, increasing the frequency of alerts.
Low Sensitivity: Focuses on the most extreme anomalies, reducing the number of alerts.
How Sensitivity Works?
During Model Building: Sensitivity sets the threshold for identifying anomalies in the training phase. For instance, with a sensitivity of 1%, only the most extreme 1% of training data will be treated as anomalies and excluded from defining normal behavior.
During Detection: Sensitivity determines the threshold for flagging anomalies. For example, with a 3% sensitivity, the model will flag the top 3% of data points with the highest anomaly indicators as anomalous.
Choosing the Right Sensitivity
Selecting the appropriate sensitivity is crucial for effective anomaly detection:
Minimizing False Positives: If you want to minimize false alerts, opt for a lower sensitivity. This is particularly useful if false positives are costly in your business context. Additionally, if you’re confident that your training data is entirely normal, setting a low sensitivity or even zero ensures that the model captures all possible patterns of normal behavior.
Catching All Anomalies: If missing an anomaly has serious consequences, choose a higher sensitivity. This increases the chances of catching all potential anomalies, even if it results in more frequent alerts. However, be cautious, as setting sensitivity too high can lead to an increase in false positives and may cause alert fatigue.
Automatic Sensitivity Estimation
By default, Tangent automatically estimates the sensitivity settings, which is particularly useful when the number of anomalies in your data is unknown.
Automatic vs. Manual:
Automatic: Good for large-scale operations and when working with unlabeled data.
Manual Adjustment: If you have specific requirements, you can manually adjust sensitivity:
Lower Sensitivity: Use this if you want to avoid frequent alerts (conservative approach).
Higher Sensitivity: Opt for this if you need to capture every potential anomaly (aggressive approach).
Example:
Imagine having a univariate process like the following and building a normal behaviour model on top of it.
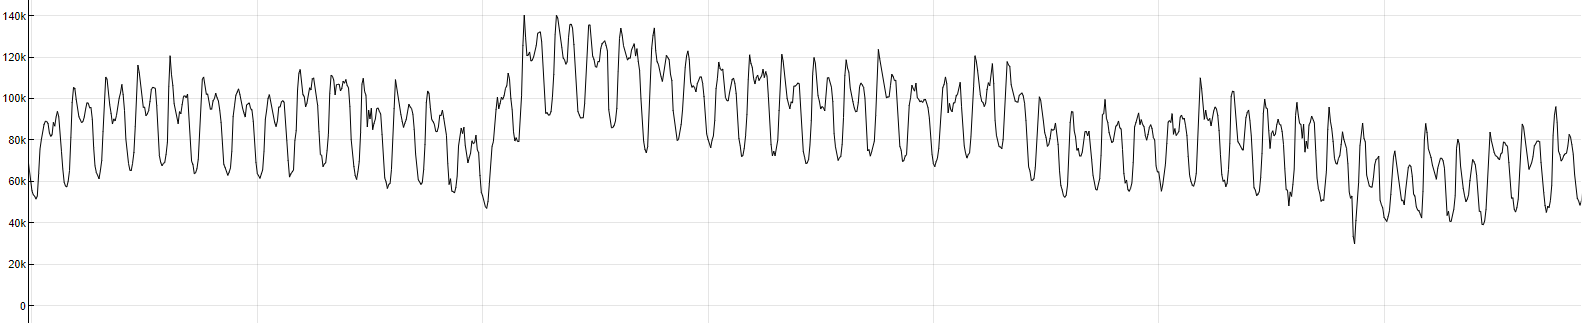
univariate training data
Let’s assume that all the data is pre-labeled as normal. If you set the sensitivity to 0, the model won’t flag any anomalies during the in-sample period. However, if you set the sensitivity to 5, the model will flag approximately 10 anomalies in the in-sample data. Whether this is desirable depends on the user’s judgment and the actual labels of anomalous events.
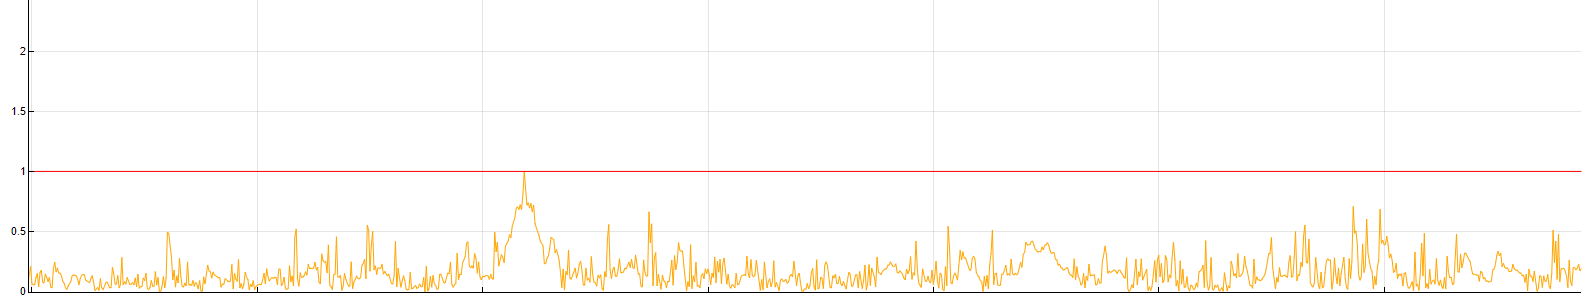
residual indicator with sensitivity 0
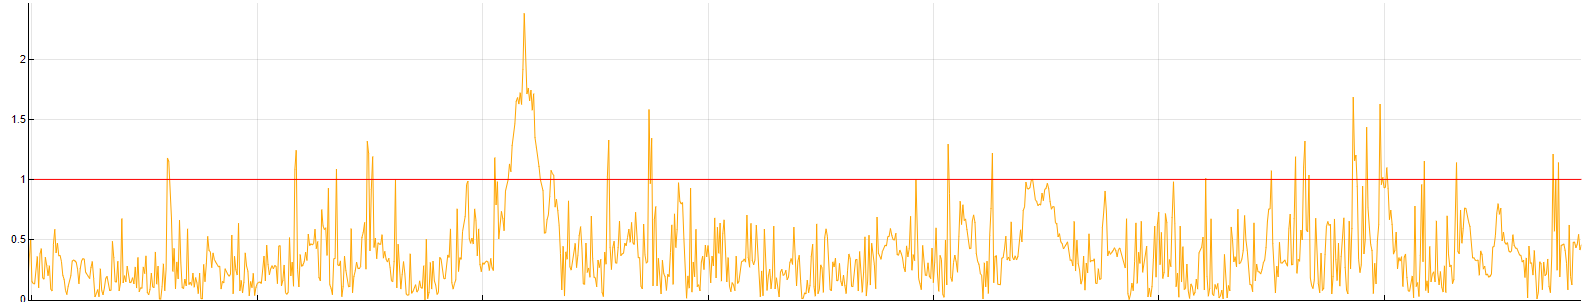
residual indicator with sensitivity 5
Anomaly Indicators
Tangent’s anomaly detection process relies on several perspectives, each designed to analyze the residuals from the normal behavior model in a unique way. These perspectives form the basis of the anomalous behavior model, allowing you to detect different types of anomalies effectively. Below is an explanation of each perspective, how they work, and what kind of anomalies they are best suited for detecting.
Residual Perspective
Transformation:

Description: Detects global outliers by analyzing the magnitude of residuals at a given timestamp.
Purpose: Identifies residuals that are significantly larger than what was observed during the in-sample period, flagging them as anomalies.
Application: Applied to detect large, unusual deviations in data, useful for spotting global outliers.
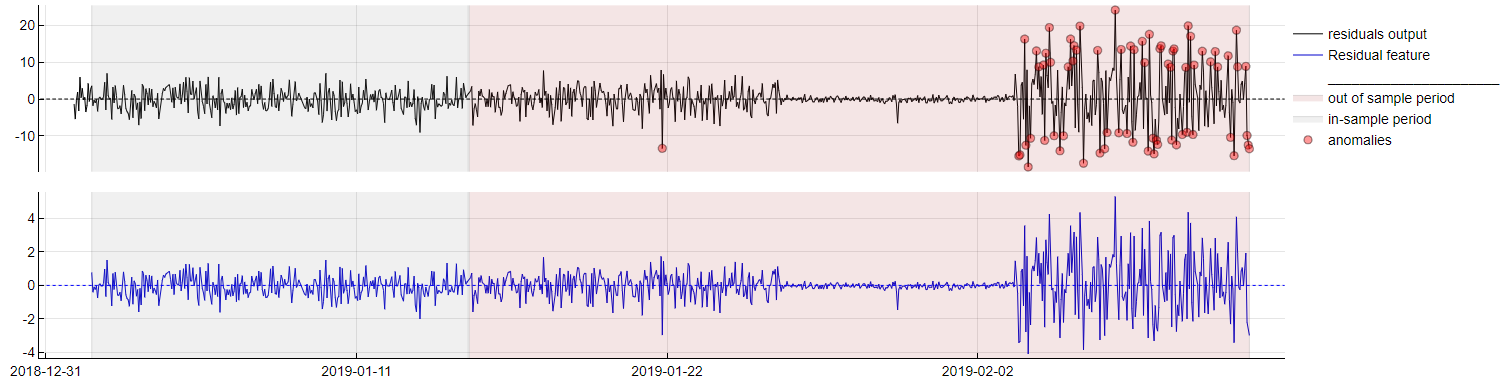
residual perspective
2. Residual Change Perspective
Transformation:
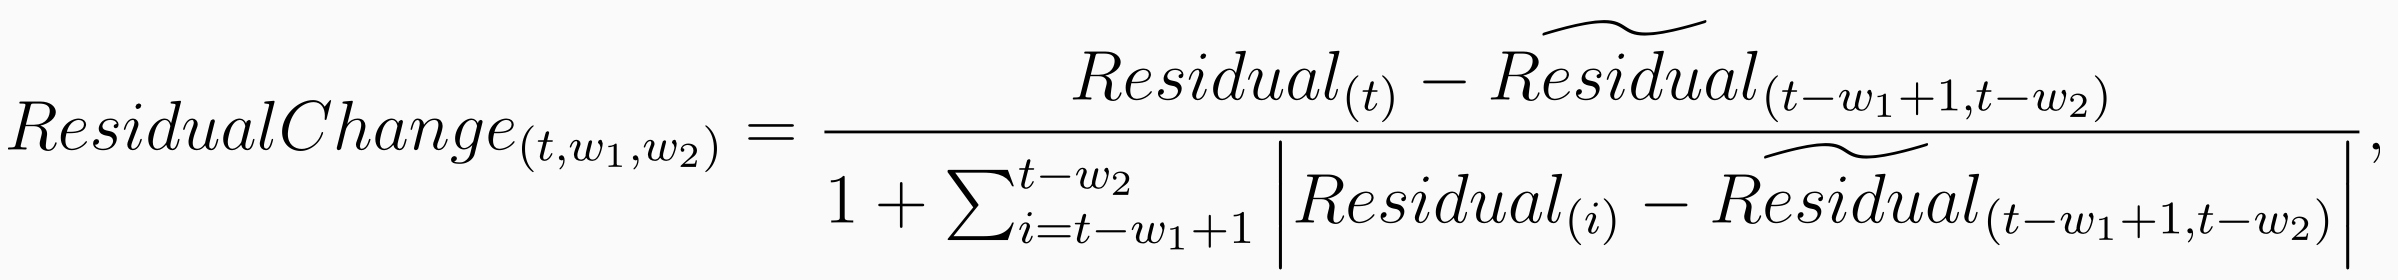
where

Description: Focuses on detecting extreme changes in residuals, particularly after stable periods.
Purpose: Identifies local outliers by detecting sudden shifts in residuals that are too drastic compared to in-sample behavior.
Application: Useful for detecting abrupt changes in data, applied to spot local anomalies that might not be captured by the magnitude alone.

residual change perspective
3. Fluctuation Perspective
Transformation:
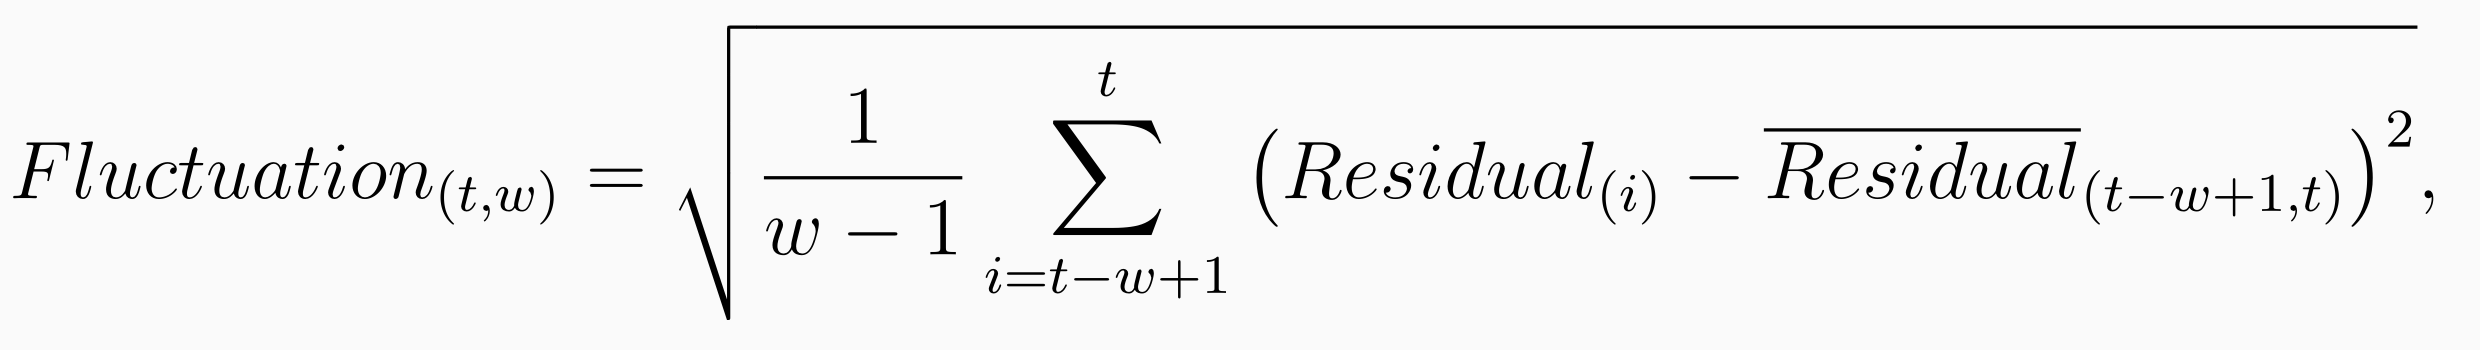
where

Description: Analyzes the fluctuation of residuals over time, detecting changes in the variability of data.
Purpose: Identifies anomalies based on differences in residual fluctuation during the out-of-sample period compared to the in-sample period.
Application: Best for detecting changes in data variability, applied to monitor and flag unusual fluctuations.
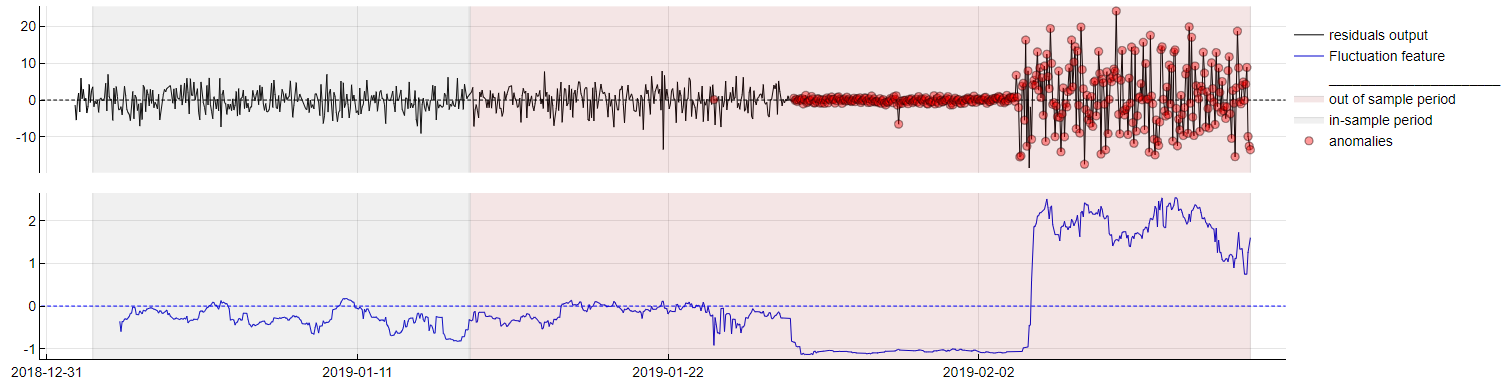
fluctuation perspective
4. Fluctuation Change Perspective
Transformation:
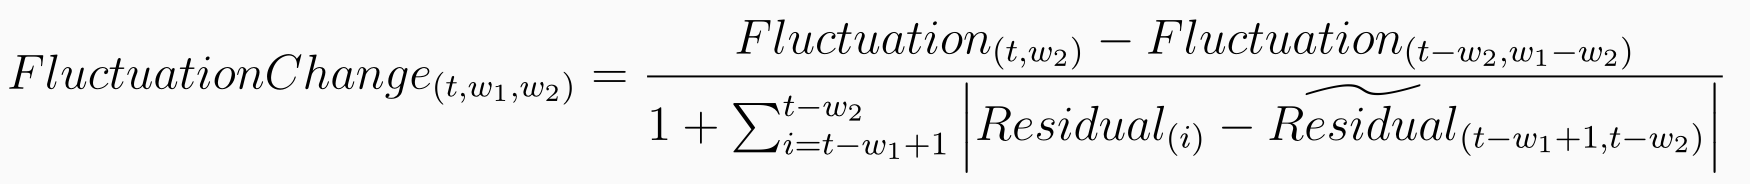
Description: Detects changes in the pattern of fluctuation, focusing on shifts in how residuals vary.
Purpose: Flags anomalies when the nature of data fluctuation changes, differing from previously observed behavior.
Application: Ideal for spotting changes in fluctuation patterns, applied to identify shifts in data behavior that could indicate anomalies.
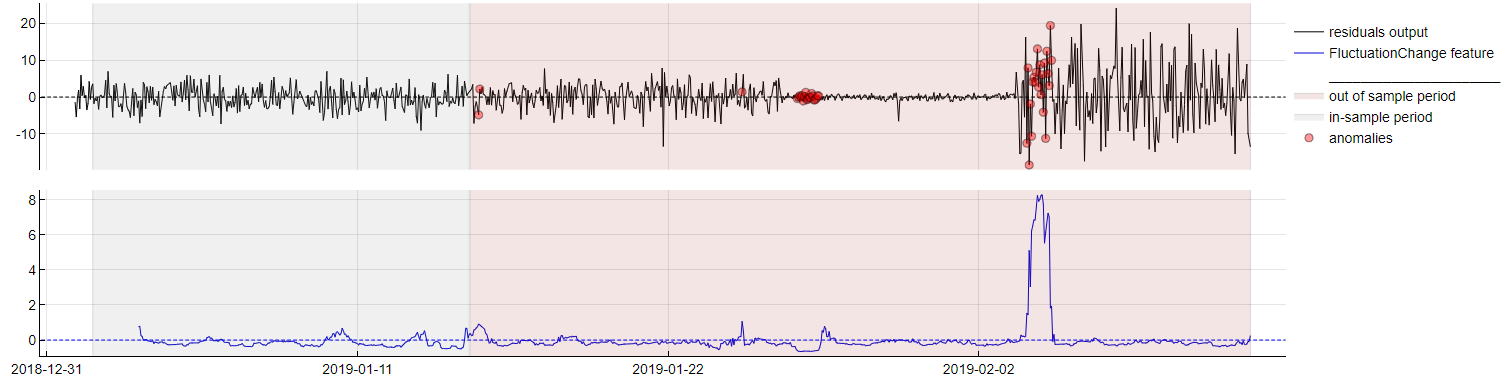
fluctuation change perspective
5. Imbalance Perspective
Transformation:
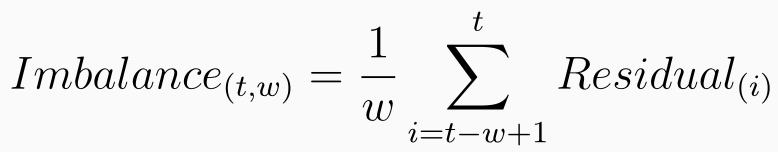
Description: Detects sustained deviations from zero in residuals, indicating periods of imbalance.
Purpose: Identifies long-term deviations from expected behavior, with the magnitude and direction reflecting the extent of the anomaly.
Application: Applied to detect trends or patterns where the data consistently deviates from the expected norm over time.
imbalance perspective
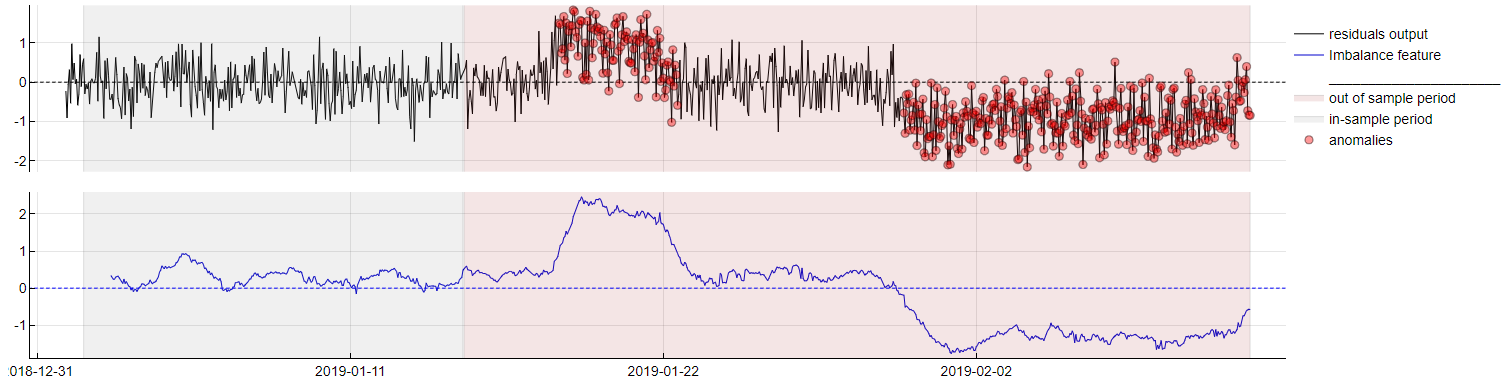
6. Imbalance Change Perspective
Transformation:

Description: Focuses on detecting shifts in the imbalance pattern, such as changes in direction or magnitude.
Purpose: Flags anomalies when there is a change in the residuals' imbalance, indicating a potential shift in underlying data behavior.
Application: Useful for detecting shifts in data behavior, applied to identify when the pattern of imbalance changes.
imbalance change perspective