Prediction Intervals
In any forecasting process, uncertainty is inevitable. Prediction intervals are a powerful tool that Tangent uses to quantify this uncertainty, providing a range within which the actual value is expected to fall. This approach allows you to make more informed decisions, especially in situations where the cost of errors—whether over-forecasting or under-forecasting—can be significant.
The Purpose of Prediction Intervals
Prediction intervals serve a critical function: they enhance your forecasts by expressing the uncertainty inherent in them. Unlike point forecasts that provide a single value, prediction intervals give you a range, offering a clearer picture of where the actual outcome is likely to land. This is especially important in complex or volatile environments where predictions can be less certain.
How Tangent Calculates Prediction Intervals
Tangent calculates prediction intervals by analyzing the errors between the target values and their corresponding forecasts during the model-building process. Specifically, it computes quantiles from these errors, which are then used to define the prediction intervals.
Dynamic Interval Width:
The width of these intervals varies depending on the level of uncertainty:
Narrow Intervals: In scenarios with low uncertainty (e.g., predicting solar production at night when output is predictably zero), the intervals are narrow.
Wide Intervals: In scenarios with high uncertainty (e.g., long-term forecasts or during volatile periods), the intervals widen to account for the increased unpredictability.
Understanding the 90% Prediction Interval
One common configuration in Tangent is the 90% prediction interval, which is defined by the 95% and 5% quantiles. This means that there is a 90% probability that the actual value will fall within this range.
Interpretation: This interval can be understood as saying, "90% of the time, the actual value will be within this range."
Customizable Confidence Level: Depending on your business needs, you can adjust the confidence level of this interval. For instance, if you want to minimize the risk of under-forecasting, you might choose a higher confidence level.
The Role of Mean vs. Median in Prediction Intervals
Tangent' forecasts typically represent the mean of a distribution. However, in some cases, the mean may not lie within the prediction interval. This can occur when the distribution is skewed, meaning the median (the middle value) differs significantly from the mean.
Why This Happens: In distributions where the median and mean are not aligned, the mean forecast might fall outside the interval. This is a natural consequence of the underlying statistical properties of the data.

mean falls outside of prediction interval
Configuring Prediction Intervals with Tangent
Tangent allows you to customize the confidence level of prediction intervals through its configuration settings. This flexibility lets you tailor the intervals to match your specific risk tolerance and business priorities, whether you need tighter intervals for conservative forecasting or wider ones for scenarios where uncertainty is higher.
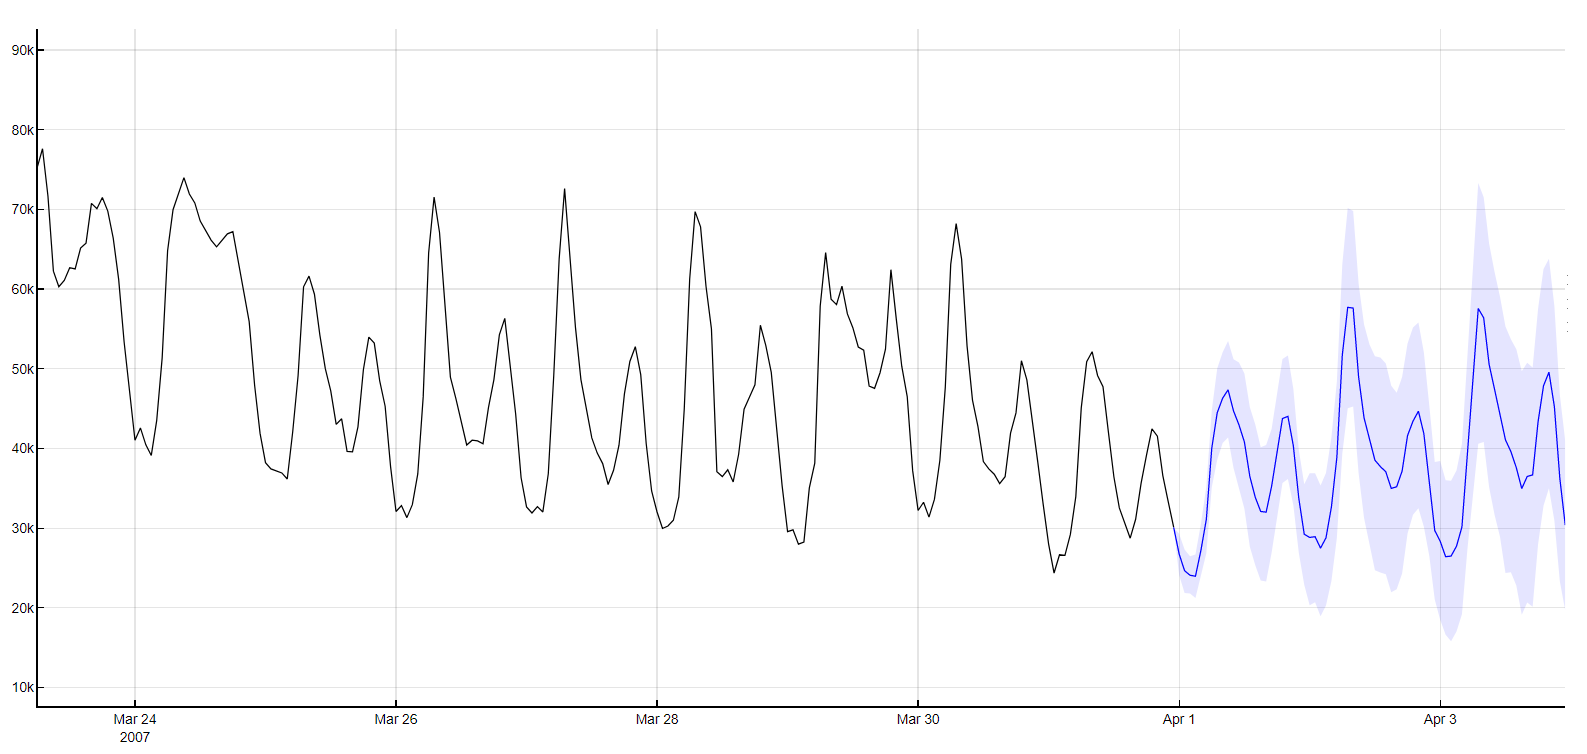
90% prediction interval using Tangent