Error measures
Introduction
Error measures are essential tools for evaluating the performance of forecasting and anomaly detection models using Tangent. This section provides concise descriptions, purposes, and practical applications of key error metrics to help users assess and improve their models.
1. Forecasting Error Measures
Forecasting error measures quantify how accurately a model predicts future values. These metrics are crucial for understanding the precision of your forecasts and identifying areas for improvement.
1.1 Mean Absolute Error (MAE)
Description: MAE calculates the average of the absolute differences between predicted and actual values.
Purpose: To provide a straightforward measure of prediction accuracy, reflecting the average error magnitude without considering its direction (positive or negative).
Application: Use MAE to gauge the overall error in your forecasts. A lower MAE indicates a model that, on average, makes smaller errors.
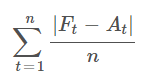
mae
1.2 Mean Absolute Percentage Error (MAPE)
Description: MAPE computes the average of the absolute percentage differences between predicted and actual values.
Purpose: To measure the accuracy of predictions in relative terms, making it easier to compare performance across different scales.
Application: Apply MAPE when you need to understand error in percentage terms, especially for comparing accuracy across different datasets. Note that MAPE can be misleading for series with values close to zero.
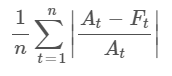
mape
1.3 Root Mean Square Error (RMSE)
Description: RMSE is the square root of the average squared differences between predicted and actual values.
Purpose: To highlight larger errors by giving more weight to significant deviations from the actual values, offering a more sensitive measure of prediction accuracy.
Application: Use RMSE to detect large errors in your predictions. Lower RMSE values indicate that the model is generally making smaller errors, especially for significant deviations.
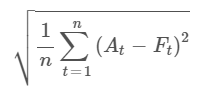
rmse
2. Anomaly Detection Error Measures
Anomaly detection error measures evaluate how effectively a model distinguishes between normal and abnormal (anomalous) data points. These metrics are critical for assessing the reliability of the anomaly detection process.
2.1 Area Under the Curve (AUC)
Description: AUC measures the probability that the model correctly ranks a randomly selected anomalous point higher than a normal point.
Purpose: To assess the model’s ability to discriminate between normal and anomalous data points, providing a single performance metric that summarizes this capability.
Application: A high AUC (typically above 0.75) indicates that the model is effective at distinguishing anomalies from normal behavior. Use AUC to evaluate and compare the overall performance of different anomaly detection models.
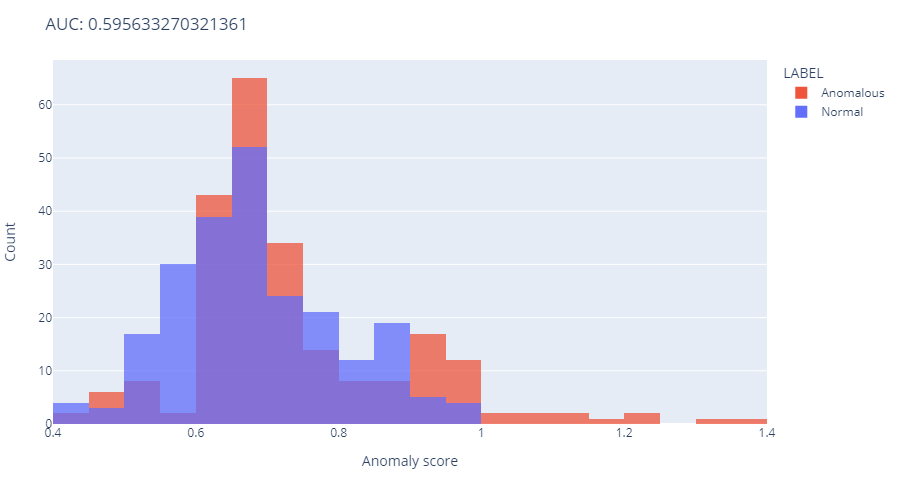
AUC
2.2 Confusion Matrix
Description: The confusion matrix records the number of correct and incorrect predictions made by the model, broken down into four categories: true positives (TP), true negatives (TN), false positives (FP), and false negatives (FN).
Purpose: To provide detailed insight into the model's prediction errors, helping identify the specific types of mistakes the model makes.
Application: Analyze the confusion matrix to understand the balance between correct and incorrect predictions. Use this information to improve the model by focusing on reducing false positives and false negatives, thereby increasing the model's overall accuracy.
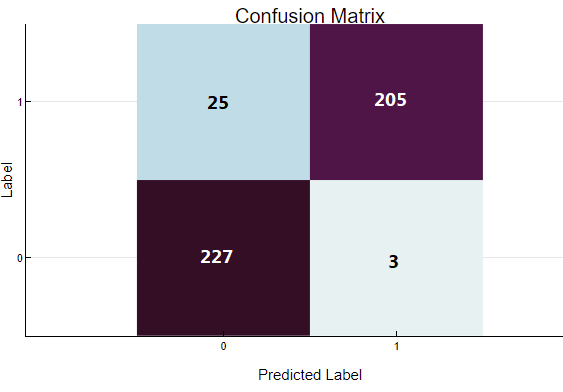
confusion matrix
Conclusion
Understanding and applying error measures is essential for assessing the accuracy and effectiveness of forecasting and anomaly detection models in Tangent. These metrics provide valuable insights into model performance, guiding users in refining their models to achieve better accuracy and reliability.