TIM Forecasting Tool
TIM Forecasting tool is an implementation of the TIM RTInstantML in Alteryx Designer application. For downloading and installation follow this manual.
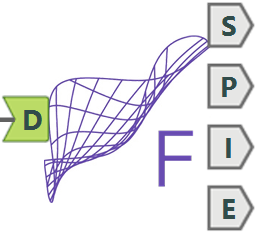
After installation, the tool is available in the Predictive category of the tool palette. You can drag & drop the tool into your canvas. The image below shows appearance of the tool icon in a workspace. The TIM Forecasting tool has one input and four outputs. By clicking on the tool a configuration pane appears.
The tool allows to run more forecasts with just one instance of the tool in canvas. If a "Group By" column is specified in the configuration pane, then each group of rows in the input dataset is considered as a separate dataset and for each of them a separate forecast is created. Modelling these datasets and running the forecasts is done in parallel; thus, the processing time is reduced in comparison with using one instance of the tool for each group.
Configuration Pane
By clicking on the tool a configuration pane appears. First you have to authenticate in order to be able to use the tool. Then you can proceed to data configuration part of the pane, see image below.
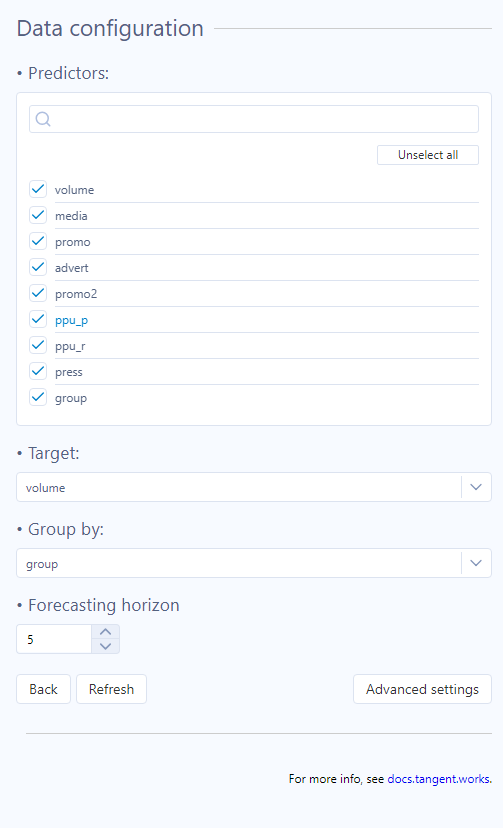
You can select:
- Predictors - columns that are used as potential predictors in the model.
- Target - a column/variable you want to predict.
- Group by - a column that separates the data rows into more groups/categories; a forecast is created for each group separately (if empty, all the data are considered as one group)
- Forecasting horizon - the length of the forecast from the last target record.
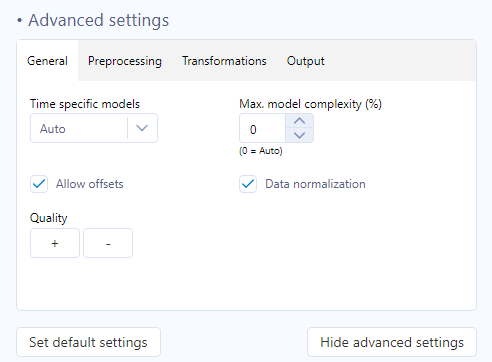
There are also advanced settings that can be adjusted for specific needs, see Configuration section to learn more.
Inputs
D - Dataset
Input datasets that are used for running the forecasting tasks. Each dataset should satisfy the dataset properties required by TIM. One additional requirement is that the timestamp has to be in the first column of the input.
Example:

Outputs
S - Status of the forecasting tasks
Status of the forecasting requests sent to the TIM API.
Example:

P - Prediction
Timestamps with corresponding predictions, upper and lower prediction interval bound and backtesting columns (backtesting is returned only if configured in advanced settings).
Example:

I - Predictor importances
Percentual importance of individual predictors in the model.
Example:

E - Feature importances
Percentual importance of features built by the engine.
Example:
